


जानिए Price to Book Value Ratio (P/B Ratio) क्या है, इसका formula, महत्व, सही interpretation, ideal P/B ratio, और निवेशकों के लिए best use cases। पूरा 2025 का SEO-friendly guide।
Introduction
शेयर मार्केट में सही valuation समझना हर निवेशक के लिए बहुत जरूरी है। Price to Book Value Ratio (P/B Ratio) एक ऐसा tool है जो यह बताता है कि कंपनी के शेयर की कीमत उसकी book value per share की तुलना में कितनी है। यह ratio खासतौर पर asset-heavy sectors जैसे banks, NBFCs, infrastructure में उपयोगी है। अगर P/B ratio 1 से कम है, तो शेयर undervalued माना जा सकता है, और 1 से अधिक होने पर निवेशक premium pay कर रहे होते हैं।
P/B ratio investors को value investing, IPO valuation, और market cycle analysis में मदद करता है। यह ratio low risk और long-term investment opportunities पहचानने में कारगर है। 2025 में AI और digital analytics के बढ़ते इस्तेमाल से P/B ratio और भी महत्वपूर्ण हो गया है। High P/B ratio growth और brand strength दिखाता है, जबकि low P/B undervaluation का संकेत देता है।
Price to Book Value Ratio क्या है?

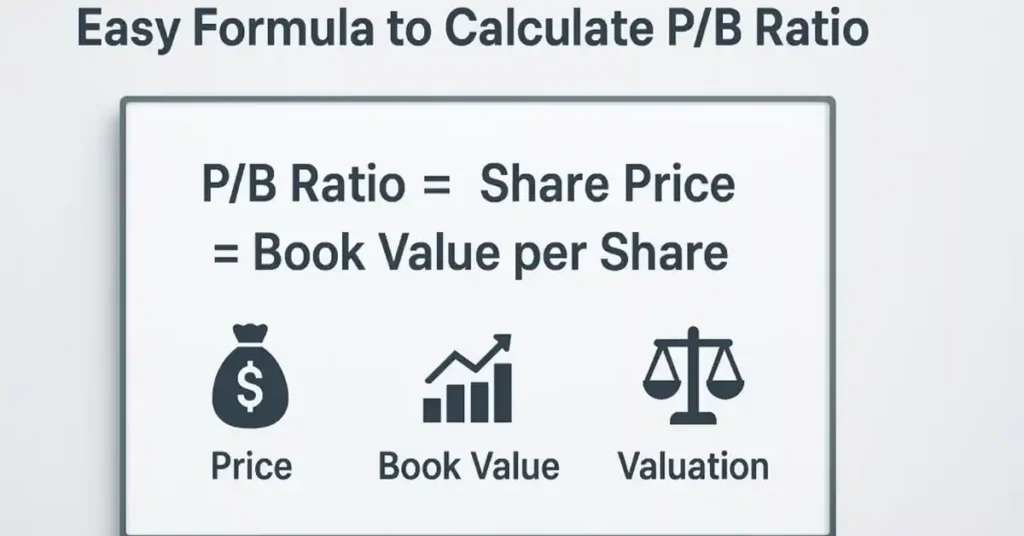
Price to Book Value Ratio (P/B) किसी कंपनी के market price को उसकी book value per share से compare करता है। Book value वह amount है जो total assets minus liabilities से निकलता है और यह shareholders’ equity को represent करता है। Formula: P/B Ratio = Share Price ÷ Book Value per Share। उदाहरण के लिए, अगर किसी कंपनी का शेयर ₹200 पर trade कर रहा है और उसकी book value ₹100 है, तो P/B ratio = 2 होगा। इसका मतलब है कि निवेशक ₹1 asset के लिए ₹2 pay कर रहे हैं।
Low P/B ratio undervalued stocks को identify करने में मदद करता है और high P/B ratio growth potential या premium pricing दर्शाता है। Asset-heavy sectors में यह ratio सबसे ज्यादा reliable होता है। Value investors इसे long-term investment strategy में core metric के रूप में इस्तेमाल करते हैं।
Book Value और Market Value का अंतर
Book Value वह मूल्य है जो balance sheet में दिखता है और इसे total assets – liabilities से calculate किया जाता है। यह historical value को दर्शाता है। दूसरी ओर, Market Value वह कीमत है जिस पर शेयर वर्तमान में market में trade होता है। P/B ratio इन दोनों के बीच का अंतर समझने में मदद करता है। जब P/B < 1 होता है, तो market undervaluation दिखाता है, और P/B > 1 होने पर investors assets से ज्यादा pay कर रहे होते हैं।
यह ratio sector-wise comparison में भी useful है। Asset-light या intangible-heavy companies में market value अक्सर book value से ज्यादा होती है, इसलिए ratio की interpretation industry-specific होती है। Value investors P/B ratio को अन्य financial metrics जैसे P/E, ROE और EV/EBITDA के साथ combine करते हैं।
Low P/B Ratio का मतलब
Low P/B ratio (<1) यह दर्शाता है कि कंपनी का market price उसकी book value से कम है। यह अक्सर undervalued stocks की पहचान करने में मदद करता है। Value investors इसे bargain opportunity मानते हैं।
हालांकि, low P/B ratio हमेशा positive नहीं होता। यह संकेत भी हो सकता है कि कंपनी के fundamentals कमजोर हैं, जैसे losses, weak management, या growth का अभाव। उदाहरण: Share Price ₹50, Book Value ₹100 → P/B = 0.5। यह undervaluation दिखाता है, लेकिन investment करने से पहले company की financial health और sector performance analyze करना जरूरी है।
Low P/B ratio banking और PSU stocks में ज्यादा common है। Bear market में यह ratio investors को attractive entry points provide करता है।
High P/B Ratio का मतलब
High P/B ratio (>1) यह बताता है कि investors company की assets की तुलना में ज्यादा pay कर रहे हैं। Growth companies, IT, FMCG और technology sectors में यह common है। उदाहरण के लिए, Infosys, HUL, और TCS का P/B ratio अक्सर 4–10 के बीच रहता है। High P/B ratio हमेशा overvaluation नहीं होता। यह company के brand value, future growth potential और earnings strength को दर्शाता है।
Value investors इस ratio को analyze करते हैं, लेकिन केवल ratio पर depend नहीं करते। High P/B ratio वाली कंपनियों में premium pay करना justified हो सकता है यदि fundamentals strong हों। यह ratio market confidence और long-term growth expectation को भी reflect करता है। Sector average से comparison करके investors decide कर सकते हैं कि high P/B justified है या overvalued।
P/B Ratio vs P/E Ratio
P/B ratio और P/E ratio दोनों valuation metrics हैं, लेकिन इनका focus अलग होता है। P/E ratio company के earnings के आधार पर valuation दिखाता है, जबकि P/B ratio company के assets के आधार पर। P/E ratio profit-making companies में ज्यादा useful है, जबकि P/B ratio asset-heavy sectors जैसे banks और infra में ज्यादा reliable है।
उदाहरण: Banking sector में P/B ratio ज्यादा महत्वपूर्ण है क्योंकि assets का आधार financial health को दिखाता है। IT और FMCG sectors में P/E ratio ज्यादा relevant है क्योंकि earnings और growth define करते हैं valuation। दोनों ratios का combined analysis investors को better decision लेने में मदद करता है। Low P/E और low P/B वाले stocks अक्सर undervalued multibagger potential दिखाते हैं।
Industry Wise P/B Ratio Trends
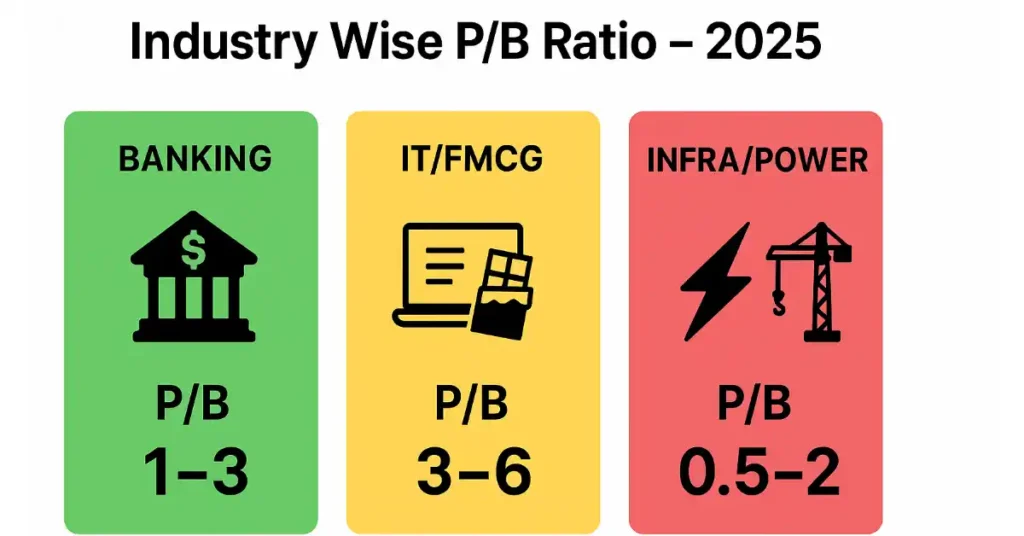
Banking sector में P/B ratio आम तौर पर 1–3 होता है। IT और FMCG sectors में यह 3–6 या उससे ऊपर हो सकता है क्योंकि growth और brand value ज्यादा होती है। Infra और Power companies में P/B ratio अक्सर 0.5–2 के बीच होता है।
2025 में Indian market में banking stocks का average P/B 1.5–2.5 होगा, IT companies 4–6 और FMCG 5+ पर trade कर सकती हैं। Sector-wise P/B comparison investors को सही entry points पहचानने और overvaluation या undervaluation का अंदाजा लगाने में मदद करता है। हर sector में ratio की interpretation अलग होती है, इसलिए peers के साथ comparison हमेशा जरूरी है।
P/B Ratio के फायदे
- Asset-heavy companies valuation में सबसे effective।
- Undervalued stocks identify करने में मदद।
- Earnings manipulation से कम प्रभावित।
- Long-term investors को margin of safety।
- Banking और NBFC sectors में most reliable।
- Value investing में core tool।
- IPO valuation में guidance।
- Bull और bear markets में strategy planning।
- Sector-wise comparison आसान।
- Risk-adjusted investment decisions में मदद।
P/B Ratio की Limitations
- Intangible assets ignore करता है।
- Tech और FMCG में misleading।
- Historical book value पर आधारित।
- Accounting standards global comparison मुश्किल।
- अकेले reliance गलत signals दे सकता है।
- Loss-making companies में कम useful।
- Market sentiment ignore करता है।
- Asset-light startups में irrelevant।
- Overly simple metric नहीं complex analysis के लिए।
- हमेशा sector peers comparison जरूरी।
Ideal P/B Ratio
Banking: 1–3, IT/FMCG: 3–6, Infra/Power: 0.5–2। Low P/B (<1) = undervalued, High P/B (>3–5) = growth or premium stock। Sector peers से comparison हमेशा जरूरी। Value investors ratio के साथ fundamentals check करते हैं।
Warren Buffett और Value Investing में P/B Ratio
Buffett low P/B stocks में invest करते हैं। यह safety margin देता है। Asset-heavy sectors जैसे banks में P/B ratio ज्यादा important है। Buffett P/B ratio के साथ earnings quality, ROE और management भी analyze करते हैं। Value investing में P/B ratio core tool है। यह ratio undervalued opportunities identify करने में मदद करता है। High-quality companies में भी P/B ratio high हो सकता है लेकिन justified होता है। Buffett strategy में ratio का combined analysis risk और returns balance करता है।
IPO Valuation और P/B Ratio
IPO valuation में P/B ratio sector peers के साथ comparison में मदद करता है। High P/B IPO महंगा हो सकता है। Low P/B IPO attractively priced हो सकता है। Banking और infra IPO में यह ratio critical है। Investors इसका use करके underpricing और overpricing का अंदाजा लगाते हैं। Sector average से comparison करना जरूरी है। Value investors IPO में P/B ratio देखकर decision लेते हैं। High P/B वाले IPO में सिर्फ hype से avoid करना चाहिए। Low P/B undervalued companies को long-term investment opportunity देता है।
Bull और Bear Market में P/B Ratio
Bull market में P/B ratio high होता है क्योंकि investors future growth पर premium pay करते हैं। Bear market में ratio low होता है और undervalued opportunities मिलती हैं। Investors low P/B stocks accumulate करते हैं। Market cycles समझने में यह ratio मदद करता है। Bull phase में high P/B overvaluation दिखाता है। Bear phase में low P/B value investing के लिए golden opportunity। Sector-wise comparison और historical P/B trends analysis market sentiment समझने में मदद करता है।
Future Trends: AI और Digital Assets
AI-driven tools P/B ratio को real-time track करने में मदद करेंगे। Asset-light और digital companies में P/B कम meaningful होगा। Asset-heavy sectors में relevance बढ़ेगा। ESG factors valuation में जोड़ेंगे। Future में investors P/B ratio को P/E, ROE और EV/EBITDA के साथ combine करेंगे। AI और fintech analytics से undervalued opportunities जल्दी detect होंगी। Digital economy में interpretation बदल सकती है।
Real-Life Example: Banking Sector
SBI P/B 1–1.5, HDFC Bank 2.5–4। PSU banks low P/B undervaluation दिखाते हैं। 2020 में crisis में PSU banks P/B 0.5 पर आए थे। Value investors ने इस मौके का फायदा उठाया। High-quality private banks का P/B ratio justified है। Investors sector peers से comparison करके entry points identify करते हैं। Banking sector में P/B ratio long-term investment decisions में core tool है।
Real-Life Example: IT और FMCG Sector
Infosys, TCS, HUL का P/B ratio 4–10। High brand value और earnings growth justify करती है। Low P/B rare होता है। Sector average से comparison करना जरूरी है। IT/FMCG investors earnings और growth metrics के साथ P/B ratio analyze करते हैं। High P/B justified है। Value investors rational decision-making के लिए P/B ratio को consider करते हैं।
FAQs
Q1. Price to Book Value Ratio क्या है?
यह ratio बताता है कि कंपनी के शेयर की कीमत उसकी book value के मुकाबले कितनी है। यह undervaluation या overvaluation समझने में investors को मदद करता है।
Q2. Low P/B ratio का क्या मतलब है?
Low P/B ratio (<1) बताता है कि शेयर undervalued है। Market price कंपनी के assets से कम है। यह value investors के लिए bargain opportunity हो सकता है।
Q3. High P/B ratio का क्या मतलब है?
High P/B ratio (>1) यह दिखाता है कि investors assets से ज्यादा pay कर रहे हैं। Growth, brand value और market confidence इसे justify कर सकते हैं।
Q4. Ideal P/B ratio कितना होना चाहिए?
Sector के हिसाब से अलग। Banking: 1–3, IT/FMCG: 3–6, Infra/Power: 0.5–2। Sector peers से comparison हमेशा जरूरी होता है।
Q5. क्या P/B ratio multibagger identify कर सकता है?
हां, low P/B stocks undervalued होते हैं। Proper research और sector comparison के बाद ये long-term में multibagger potential दे सकते हैं।
Q6. P/B ratio और P/E ratio में अंतर क्या है?
P/E ratio earnings पर आधारित है, जबकि P/B ratio assets पर। दोनों ratios combined valuation analysis में मदद करते हैं।
Q7. P/B ratio loss-making companies में useful है?
नहीं। Loss-making और asset-light companies में P/B ratio कम meaningful होता है क्योंकि assets या book value पर्याप्त संकेत नहीं देते।
Q8. High P/B ratio हमेशा negative है?
नहीं। Growth companies, strong brands और future earning potential वाली firms में high P/B ratio justified और sustainable हो सकता है।
Q9. Value investing में P/B ratio क्यों जरूरी है?
यह undervalued stocks identify करने और investment में safety margin provide करने में मदद करता है। Value investors इसे core metric मानते हैं।
Q10. IPO valuation में P/B ratio कैसे useful है?
IPO के लिए P/B ratio sector peers से compare कर overpriced या underpriced stocks पहचानने में मदद करता है। यह initial investment decision guide करता है।
Q11. Indian banking sector में average P/B ratio क्या है?
सामान्यत: 1–3 के बीच। Private banks में यह 2.5–4 तक जा सकता है, जबकि PSU banks में अक्सर lower side पर रहता है।
Q12. P/B ratio global comparison में reliable है?
Accounting standards अलग होने और intangible assets की difference के कारण global comparison हमेशा exact नहीं होता। Sector-specific analysis अधिक reliable है।
Q13. Bear market में P/B ratio कैसे काम आता है?
Bear market में P/B ratio low होता है। यह undervalued opportunities दिखाता है और value investors के लिए profitable entry points provide करता है।
Q14. FMCG sector का average P/B ratio क्या है?
FMCG companies का P/B ratio आमतौर पर 5 या उससे अधिक होता है, क्योंकि ये growth और brand value पर depend करती हैं।
Q15. P/B ratio fraud companies detect कर सकता है?
सीधे नहीं, लेकिन unusually high या low P/B ratio suspicious हो सकता है। इसे अन्य financial metrics के साथ analyze करना जरूरी है।
Q16. P/B ratio banking stocks में क्यों जरूरी है?
Banks asset-heavy होते हैं। P/B ratio उनके valuation को समझने, undervaluation या premium identify करने और smart investment decision लेने में मदद करता है।
Q17. P/B ratio केवल long-term investors के लिए है?
Mostly हां। यह long-term value investing में core metric है और short-term trading में कम relevant होता है।
Q18. Asset-light companies में P/B ratio effective है?
नहीं। Tech startups और digital companies में assets कम होते हैं, इसलिए P/B ratio कम meaningful होता है।
Q19. Warren Buffett P/B ratio को महत्व देते हैं?
हाँ। खासकर banking और insurance sectors में, Buffett undervalued opportunities identify करने के लिए P/B ratio analyze करते हैं।
Q20. 2025 में P/B ratio का future क्या है?
Asset-heavy sectors में P/B ratio की importance बढ़ेगी। Digital economy और AI tools के साथ इसका interpretation थोड़ा different हो सकता है।
Conclusion
Price to Book Value Ratio (P/B Ratio) शेयर मार्केट में एक महत्वपूर्ण valuation tool है। यह investors को बताता है कि वे किसी कंपनी के assets के मुकाबले कितनी कीमत चुकाने जा रहे हैं। Low P/B ratio undervaluation दिखाता है और long-term value investing के लिए opportunities प्रदान करता है, जबकि high P/B ratio growth, brand value और market confidence का संकेत देता है।
यह ratio खासकर asset-heavy sectors जैसे banking, NBFCs और infrastructure में ज्यादा reliable है। P/B ratio को P/E, ROE और EV/EBITDA के साथ combine करके holistic valuation किया जा सकता है। Sector-wise comparison और historical trends analysis investors को सही entry और exit points identify करने में मदद करता है। 2025 और आगे भी P/B ratio fundamental analysis का core part रहेगा। सही research, sector comparison और risk analysis के साथ यह investors के लिए wealth creation में अहम भूमिका निभाता है।
Disclaimer
इस ब्लॉग में दी गई जानकारी केवल educational और informational purposes के लिए है। इसमें कोई financial advice या investment recommendation नहीं दी गई है। शेयर मार्केट में निवेश जोखिमपूर्ण होता है। निवेश करने से पहले हमेशा स्वयं रिसर्च करें और जरूरत पड़ने पर financial advisor से परामर्श लें। लेखक और वेबसाइट किसी भी निवेश निर्णय की जिम्मेदारी नहीं लेते।

