

Price to Earnings Ratio (P/E Ratio) क्या है? जानिए P/E ratio calculation, example, high vs low P/E, PEG ratio, IPO valuation और निवेश में इसका सही इस्तेमाल 2025 में।
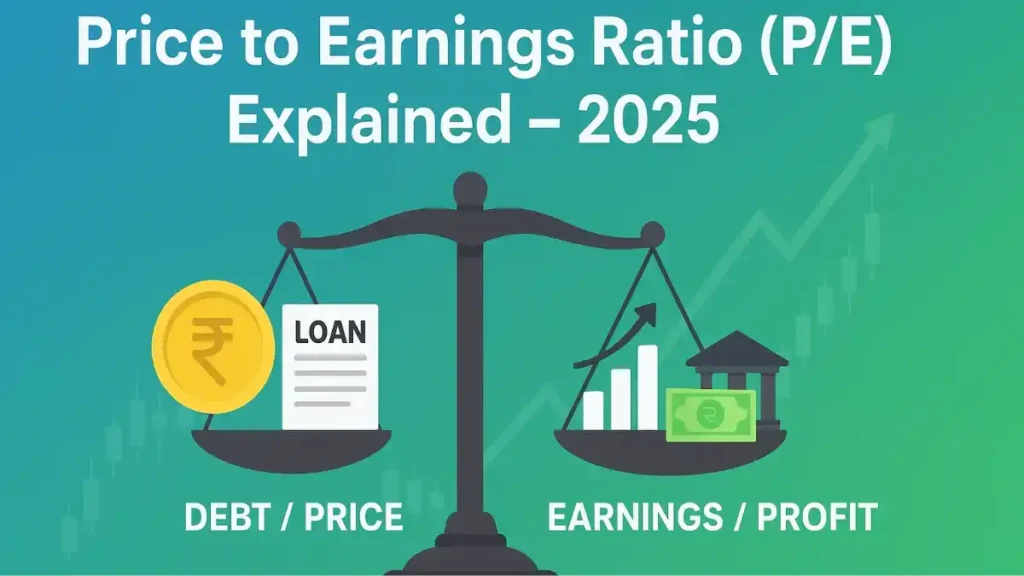
1. परिचय: P/E Ratio क्या है?
Price to Earnings Ratio (P/E Ratio) stock market में valuation का सबसे important tool है। यह बताता है कि किसी कंपनी का शेयर price उसकी earnings के मुकाबले कितना महंगा या सस्ता है। उदाहरण के लिए, अगर किसी कंपनी का share price ₹1000 और EPS ₹50 है, तो P/E Ratio 20 होगा। इसका मतलब है कि investors ₹1 की earnings के लिए ₹20 देने को तैयार हैं।
P/E Ratio सिर्फ valuation नहीं बताता, बल्कि यह market sentiment और growth expectation को भी reflect करता है। नए और experienced investors दोनों इसे fundamental analysis में use करते हैं। Smart investing में P/E के साथ PEG, ROE, debt ratio और sector comparison भी check करना चाहिए।
2. EPS (Earnings Per Share) क्या है?

EPS यानी Earnings Per Share, किसी कंपनी की net profitability को हर share के हिसाब से दिखाता है। Formula: EPS = Net Profit ÷ Total Outstanding Shares। उदाहरण: अगर net profit ₹100 करोड़ और shares 10 करोड़ हैं, तो EPS = ₹10।
Higher EPS मतलब company की earning strong है। EPS P/E ratio calculation का foundation है। सिर्फ EPS देखकर stock valuation का judgment देना गलत है। Investors को company के growth rate, sector और market trends भी ध्यान में रखना चाहिए। P/E और EPS मिलकर stock का fair value indicate करते हैं।
3. P/E Ratio का महत्व
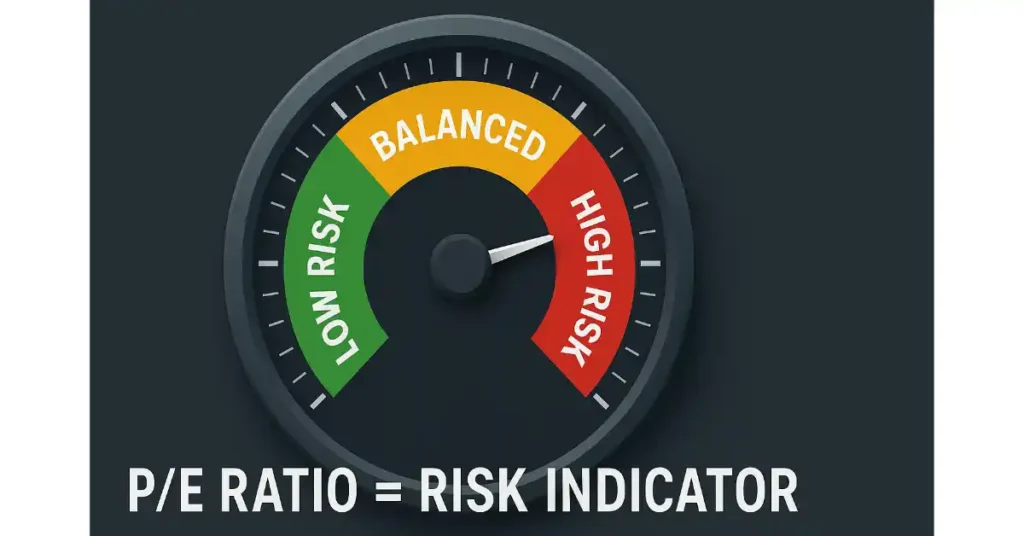
P/E Ratio investors को यह समझने में मदद करता है कि stock overvalued है या undervalued। High P/E ratio indicate करता है कि market company की future growth expect कर रहा है। Low P/E ratio undervalued stock या slow growth company का signal देता है।
Long-term investors P/E ratio को PEG, ROE और debt ratio के साथ analyze करते हैं। Short-term traders price movement और charts पर focus करते हैं, लेकिन historical P/E और sector average देखें तो short-term decision भी informed बनता है।
4. High vs Low P/E Ratio
High P/E ratio मतलब investors growth के लिए premium दे रहे हैं। IT और FMCG sectors में high P/E normal है। Low P/E undervalued या slow growth company का signal दे सकता है। Infra, Power और PSU sectors में low P/E आम है।
High P/E हमेशा अच्छा और Low P/E हमेशा बुरा नहीं होता। Investors को sector comparison, growth prospects और company fundamentals check करना चाहिए। Historical trends और market sentiment भी decision-making में मदद करते हैं।
5. Forward vs Trailing P/E
Trailing P/E पिछले 12 months की actual earnings पर आधारित होता है। Forward P/E अगले 12 months की estimated earnings पर आधारित होता है। Trailing P/E past performance दिखाता है, Forward P/E growth expectation।
IPO valuation और mutual funds decisions में Forward P/E important है। Retail investors और professional fund managers दोनों metrics analyze करके stock selection करते हैं। High Forward P/E indicate कर सकता है कि market company की future growth के लिए confident है।
6. Industry Wise P/E
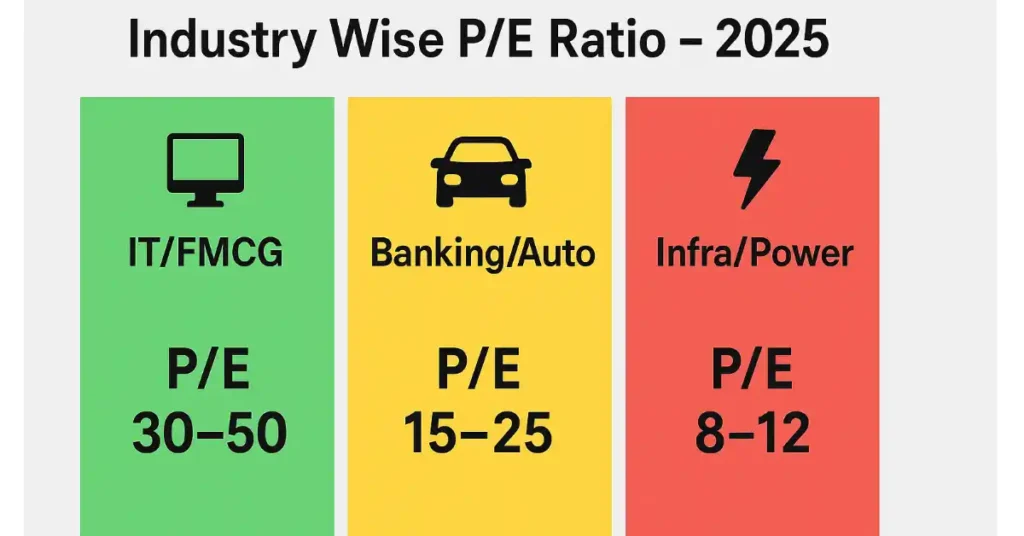
हर industry का P/E अलग होता है। IT और FMCG sectors में high P/E normal है, जबकि Automobile और Banking में medium P/E और Infra, Power sectors में low P/E common है।
Investor को हमेशा same industry companies compare करनी चाहिए। High growth sectors में high P/E justified हो सकता है, cyclical sectors में low P/E attractive लग सकता है। Industry wise P/E comparison undervalued और overvalued stocks identify करने में मदद करता है।
7. Limitations of P/E Ratio
P/E ratio पूरी picture नहीं देता। Earnings manipulation, sector differences और growth ignore करने से ratio misleading हो सकता है। Market hype या sentiment से भी P/E fluctuate होता है।
P/E alone investment decision के लिए पर्याप्त नहीं है। Investors को PEG ratio, ROE, debt levels और sector analysis के साथ combined evaluation करना चाहिए। केवल low या high P/E देखकर investment करना गलत हो सकता है।
8. PEG Ratio
PEG Ratio = P/E ÷ Earnings Growth Rate। यह growth factor consider करता है। High P/E लेकिन high growth वाले stock fair valuation में आ सकते हैं। PEG ratio investors को P/E से ज्यादा reliable valuation check देता है।
Investors PEG ratio analyze करके decide करते हैं कि कोई high P/E stock justified है या overvalued। Long-term investing में PEG ratio का use बढ़ता जा रहा है।
9. Real-Life Indian Examples
- Infosys → P/E ~28, justified due to growth
- HUL → P/E ~55, high but stable
- Tata Steel → P/E ~8, undervalued, growth limited
इन examples से पता चलता है कि P/E alone decision-making के लिए पर्याप्त नहीं है। Fundamentals, sector comparison और growth potential भी ध्यान में रखना चाहिए। Historical P/E और forward P/E analyze करके better decisions ले सकते हैं।
10. Long-Term Investors और P/E
Long-term investors P/E ratio को PEG, ROE और debt levels के साथ analyze करते हैं। Low P/E + strong fundamentals वाली companies golden investment opportunities होती हैं।
High P/E justified हो सकती है अगर company का growth strong है। Long-term investing में sector comparison, historical P/E trends और market sentiment भी consider किया जाता है।
11. Short-Term Traders और P/E
Short-term traders के लिए P/E ratio उतना impactful नहीं। उनका main focus price movement और charts पर होता है। हालांकि, historical P/E trends और sector average देखना short-term strategies में मदद करता है।
High या low P/E short-term market swings और sentiment को समझने में guidance देता है। कुछ traders Forward P/E use करते हैं ताकि growth expectation और hype को consider किया जा सके। Short-term trading में risk management और market volatility analysis ज्यादा important होते हैं। P/E ratio केवल supporting tool की तरह use होता है।
12. India vs USA Market P/E
India में investors growth के लिए ज्यादा premium देने को तैयार रहते हैं। Nifty 50 का average P/E लगभग 22–25 है। USA में S&P 500 का P/E moderate 18–22 रहता है।
Emerging markets में high P/E normal है क्योंकि investors future growth expect करते हैं। Developed markets में P/E moderate होता है। Investors global market comparison से sector-wise opportunities और valuation trends समझ सकते हैं।
13. Historical P/E Trends
Nifty 50 historical P/E trends market sentiment और valuation को समझने में मदद करते हैं।
- 2000 → P/E ~20
- 2008 → P/E crash ~15
- 2020 Covid → P/E spike 25–30
Trend analysis investors को overvalued और undervalued market identify करने में guide करता है। Historical P/E data long-term investment decisions और market timing में valuable है।
14. Buffett & Global Investors का View
Warren Buffett कहते हैं – “Buy a wonderful company at fair price.” High P/E justified हो सकता है अगर growth strong हो।
Global investors P/E ratio को fundamentals और sector analysis के साथ check करते हैं। केवल low या high P/E देखकर investment करना गलत है। P/E ratio के साथ PEG, ROE और debt levels evaluate करना smart investing की key है।
15. Indian Case Studies और IPO P/E
- Reliance → P/E 25–35 historically
- HDFC Bank → consistently high P/E
- Zomato → IPO high P/E, growth expectation
- Paytm → IPO high P/E, debated by investors
IPO valuation में Forward P/E बहुत important है। High P/E justified हो सकता है यदि company का growth potential strong हो। Investors historical और industry P/E trends भी देखते हैं।
16. P/E vs Other Financial Ratios
| Ratio | Usefulness | Comparison |
|---|---|---|
| P/B | Asset valuation | Price to Book |
| EV/EBITDA | Debt + profit factor | Enterprise Value |
| Dividend Yield | Income estimation | Return potential |
P/E alone sufficient नहीं है। Combination of ratios, growth और sector analysis investment decision को strong बनाता है।
17. Global Market Comparison
- India → high P/E
- USA → moderate P/E
- China → high volatility
Emerging markets में investors future growth के लिए premium देते हैं। Global P/E trends analysis से sector-wise opportunities और risk management आसान होता है।
18. Common Myths & Reality
- Low P/E = हमेशा अच्छा ×
- High P/E = हमेशा bubble ×
- P/E alone = decision maker x
Reality: P/E + PEG + sector + fundamentals combination सही investment decision देता है। Investors myths ignore करके rational evaluation करें। High growth sectors में high P/E justified हो सकता है।
19. Retail Investors की गलती
Retail investors अक्सर सिर्फ low P/E देखकर stock खरीद लेते हैं। High P/E ignore कर देते हैं।
सही तरीका: Sector comparison + fundamentals + growth analyze करना। Value traps से बचना और long-term growth potential evaluate करना जरूरी है। Historical trends और market sentiment देखें।
20. Actionable Investment Tips
- Industry average P/E compare करें
- PEG ratio देखें
- Fundamentals verify करें
- Debt levels + ROE analyze करें
- Blindly low P/E पर buy न करें
Smart investing P/E ratio के साथ growth, sector और financial health को balance करता है। Long-term portfolio strategy में combined analysis जरूरी है।
Faqs
Q1. P/E Ratio kya hai?
Price to Earnings Ratio बताता है कि stock market में किसी शेयर की कीमत उसकी earnings के मुकाबले कितनी है।
Q2. Normal P/E ratio कितना होना चाहिए?
Sector और market condition पर depend करता है। आमतौर पर 15–25 average माना जाता है।
Q3. Negative P/E का मतलब क्या है?
Company loss में है और EPS negative है। इसका मतलब investors profit expect नहीं कर सकते।
Q4. High P/E stock हमेशा बुरा है?
High P/E हमेशा गलत नहीं। Growth potential और sector fundamentals justify कर सकते हैं।
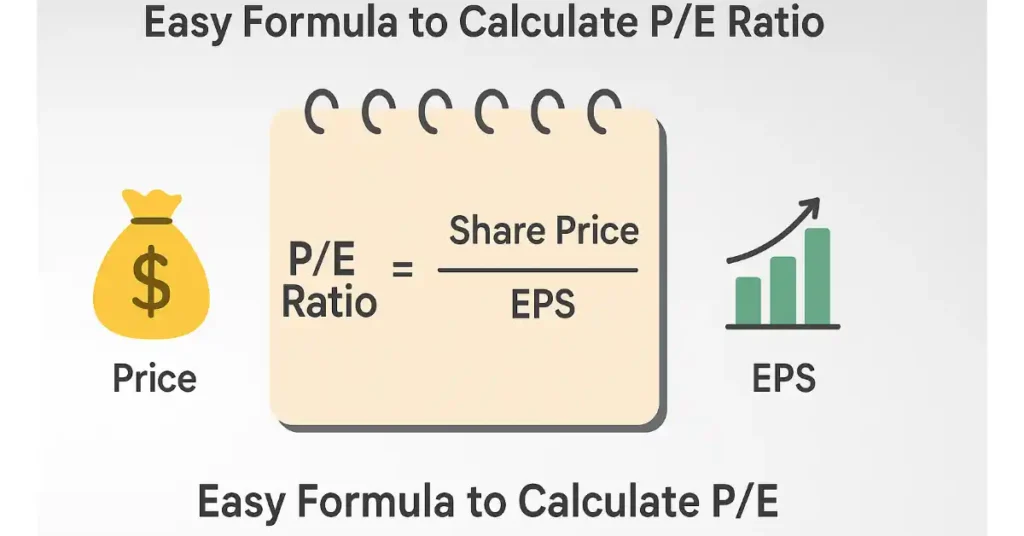
Q5. P/E ratio kaise calculate kare?
P/E = Share Price ÷ EPS. यह simple formula valuation समझने में मदद करता है।
Q6. Forward vs Trailing P/E में difference क्या है?
Trailing P/E past earnings पर है, Forward P/E future estimated earnings पर आधारित होता है।
Q7. IPO P/E high क्यों होता है?
IPO में growth expectation और hype से share price ज्यादा होता है।
Q8. P/E vs PEG Ratio कौन सा better है?
PEG ratio growth factor consider करता है, इसलिए fair valuation के लिए PEG ज्यादा reliable है।
Q9. Industry wise P/E comparison क्यों जरूरी है?
हर sector का average P/E अलग होता है। Accurate valuation के लिए same industry comparison जरूरी है।
Q10. Mutual funds P/E क्यों देखते हैं?
Portfolio valuation और investment decision के लिए mutual funds P/E analyze करते हैं।
Q11. High P/E का मतलब क्या है?
High P/E मतलब investors growth की उम्मीद कर रहे हैं और stock premium पर trade हो रहा है।
Q12. Low P/E का मतलब क्या है?
Low P/E undervalued stock या slow growth company का संकेत हो सकता है।
Q13. P/E ratio invest decision में क्यों important है?
Valuation समझने और sector comparison करने के लिए P/E ratio मुख्य metric है।
Q14. Historical P/E trends क्यों देखें?
Market sentiment और overvalued/undervalued signals historical P/E trends से समझ सकते हैं।
Q15. Buffett P/E को कैसे use करते हैं?
Fundamentals और sector के साथ P/E analyze करते हैं, blindly high/low P/E पर decision नहीं लेते।
Q16. P/E ratio केवल growth companies में useful है?
Growth + stable fundamentals वाली companies में ज्यादा useful है, cyclical sectors में context-dependent।
Q17. P/E ratio alone reliable क्यों नहीं है?
Growth, debt, ROE और PEG consider किए बिना P/E alone misleading हो सकता है।
Q18. P/E ratio कैसे market bubble signal देता है?
Average P/E historical से बहुत high → market overvalued → bubble alert।
Q19. Short-term traders P/E क्यों ignore करते हैं?
Price movements और charts पर focus होता है, P/E short-term volatility नहीं capture करता।
Q20. P/E ratio vs ROE कौन सा better है?
P/E valuation दिखाता है, ROE profitability। दोनों combined smart decision देने में मदद करते हैं।
Conclusion
Price to Earnings Ratio (P/E Ratio) शेयर बाजार का एक बेहद महत्वपूर्ण valuation tool है जो किसी भी investor को यह समझने में मदद करता है कि कोई stock महंगा है या सस्ता। हालांकि सिर्फ P/E देखकर निवेश का फैसला करना सही नहीं होता। Investor को हमेशा EPS, PEG ratio, ROE, debt ratio, industry average और historical P/E trends का भी ध्यान रखना चाहिए।
High P/E growth potential वाली कंपनियों के लिए justified हो सकता है, जबकि low P/E value trap भी बन सकता है। Retail investors को blindly low P/E वाले stocks खरीदने की गलती नहीं करनी चाहिए। Smart investing हमेशा combined analysis और long-term vision पर आधारित होना चाहिए।
अगर आप सही तरह से P/E ratio को अन्य financial ratios और sector comparison के साथ use करेंगे, तो आप undervalued stocks identify कर पाएंगे और बेहतर long-term wealth create कर पाएंगे।
Disclaimer
यह blog educational purpose के लिए है। इसमें दी गई जानकारी किसी भी investment advice के रूप में नहीं है। निवेश से पहले financial advisor से consult करें।

