

Stock Market में Volume Analysis कैसे करें और profitable trading के लिए OBV, VWAP, Chaikin Money Flow, और Volume Profile जैसी volume indicators का step-by-step use करें। Beginners से experts तक complete guide।
Introduction: Volume Analysis क्या है और क्यों Important है
Stock Market में सिर्फ price movement देखकर trade करना profitable नहीं होता। Price alone trend की strength या sustainability नहीं बताता। इसी वजह से Volume Analysis in Stock Market एक essential tool है।
Volume का मतलब है कि किसी stock में एक specific time period में कितने shares या contracts trade हुए।
- High Volume + Price Up: Strong bullish trend
- Low Volume + Price Up: Weak move, reversal possible
- High Volume + Price Down: Strong selling, bearish trend
- Low Volume + Price Down: Weak selling, continuation possible
Volume Analysis से पता चलता है कि trend real है या सिर्फ temporary। यह beginners और experienced traders दोनों के लिए crucial है क्योंकि इससे profitable trading और risk management आसान होता है।
Volume Analysis vs Price Analysis

Stock Market में सिर्फ price movement देखकर trade करना profitable नहीं होता। Price alone trend की strength और sustainability नहीं बताता। इसी वजह से Volume Analysis essential है।
Volume का मतलब है किसी stock में एक specific time period में कितने shares या contracts trade हुए। High volume + price up → Strong bullish trend; Low volume + price up → Weak move या reversal possible; High volume + price down → Strong selling, bearish trend; Low volume + price down → Weak selling, trend continuation possible।
Price और volume दोनों को analyze करके traders strong entry और exit points identify कर सकते हैं। Beginners और experts दोनों के लिए combined approach ज़रूरी है क्योंकि यह risk management और profitable trading सुनिश्चित करता है।
Volume confirm करने से false breakouts avoid होते हैं। Price और volume का relationship समझकर traders सही trend और market sentiment evaluate कर सकते हैं।
Different Types of Volume in Stock Market
Stock trading में अलग-अलग types of volume हैं।
- Daily Volume: रोज trade हुए shares। Intraday trading और short-term analysis में essential।
- Average Volume: 20-day या 50-day average volume। Trend spikes और unusual interest identify करने में मदद।
- Relative Volume: Current volume / Average volume; >1 → unusual interest, <1 → low interest।
- Block Trades & Institutional Volume: Large trades indicate institutional activity; retail investors का volume भी trend प्रभावित कर सकते हैं।
हर type of volume traders को market interest, liquidity और trend की strength समझने में मदद करता है। Daily और average volume monitor करके entry/exit points optimize किए जा सकते हैं। Relative volume unusual trading activity detect करने में मदद करता है। Block trades और institutional volume trends का early signal देते हैं।
Proper volume analysis से traders profitable decisions ले सकते हैं और market fluctuations में ज्यादा confident रहते हैं।
Price-Volume Relationship
Price और volume का relationship trend की strength और sustainability समझने में crucial है।
- High volume + Price Up: Strong bullish trend
- Low volume + Price Up: Weak trend, reversal possible
- High volume + Price Down: Strong selling, bearish trend
- Low volume + Price Down: Weak selling, continuation
Traders इसे candlestick patterns, support-resistance, trendlines के साथ combine करते हैं। Intraday और swing trading में यह especially important है। Volume confirm करने से false breakouts और reversals avoid होते हैं।
Volume analysis से market sentiment और participation समझा जा सकता है। Price alone misleading हो सकता है, लेकिन volume confirm करके entry और exit points accurate बनते हैं। Traders high/low volume spikes identify करके short-term और long-term strategy adjust करते हैं।
Volume & Candlestick Patterns
Candlestick patterns + volume confirmation trading signals को reliable बनाते हैं।
- Hammer + High Volume: Strong reversal
- Shooting Star + High Volume: Bearish reversal
- Bullish Engulfing + Volume Increase: Confirmed uptrend
- Bearish Engulfing + High Volume: Strong downtrend
Candlestick patterns alone misleading हो सकते हैं। Volume confirm करने से trend की strength और sustainability clear होती है। Traders अक्सर OBV, CMF और VWAP indicators combine करते हैं।
Volume analysis से beginners और experienced traders दोनों को trend confirmation मिलती है। False breakouts और reversals detect करना आसान होता है। High volume patterns entry/exit timing improve करते हैं। Volume + candlestick combination से risk कम और profit potential maximize होता है।
Volume Analysis for Different Market Segments
Volume analysis market segment पर depend करता है।
- Intraday Trading: High volume breakouts → Entry; Low volume pullbacks → Exit; Relative Volume monitor करें।
- Swing Trading: Trend duration और reversal points identify करें; Trend continuation → Low volume pullback; Trend reversal → High volume breakout।
- Long-Term Investing: Accumulation/Distribution zones monitor; Institutional activity evaluate करें; Trend strength confirm करें।
Har segment में proper volume analysis risk कम और profit maximize करता है। Traders entry/exit points और trend confirmation accurate बना सकते हैं। Intraday traders quick moves capture करते हैं, swing traders short-term trends monitor करते हैं, और long-term investors accumulation/distribution zones track करते हैं।
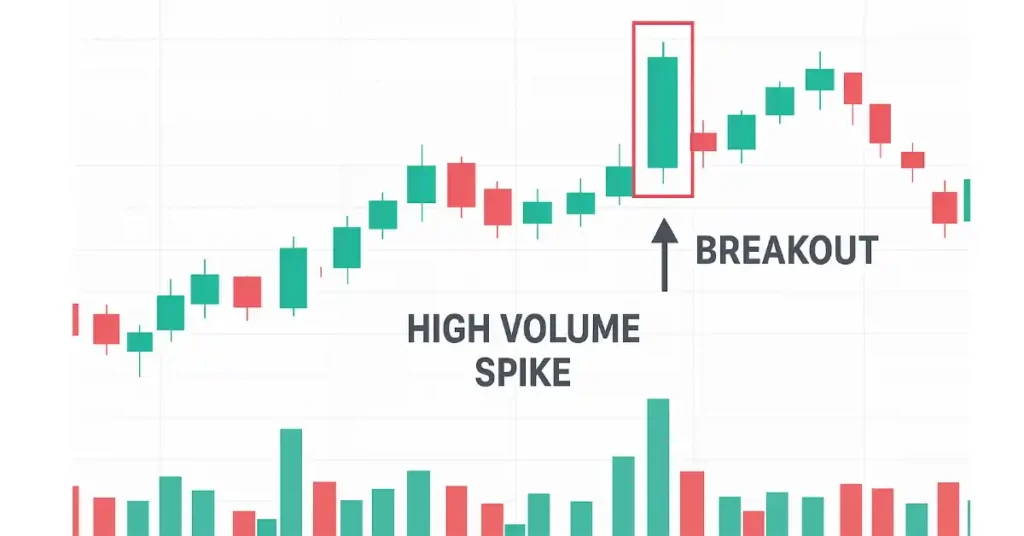
Volume-Based Trading Strategies
- Breakout Strategy: Support/resistance break + high volume → Entry; Stop-loss below breakout।
- Pullback Strategy: Low volume retrace → Trend continuation entry।
- Volume Divergence Strategy: Price new high/low, volume opposite → Trend reversal।
- VWAP & Volume Profile: Intraday trading key levels identify।
Ye strategies beginners और experienced traders दोनों के लिए profitable trading ensure करती हैं। OBV, CMF और VWAP combine करके strategy reliability improve होती है। Volume spikes और divergence detect करके trend confirm किया जा सकता है। Proper strategy use से entry/exit timing accurate होती है।
Sector-Wise Volume Analysis
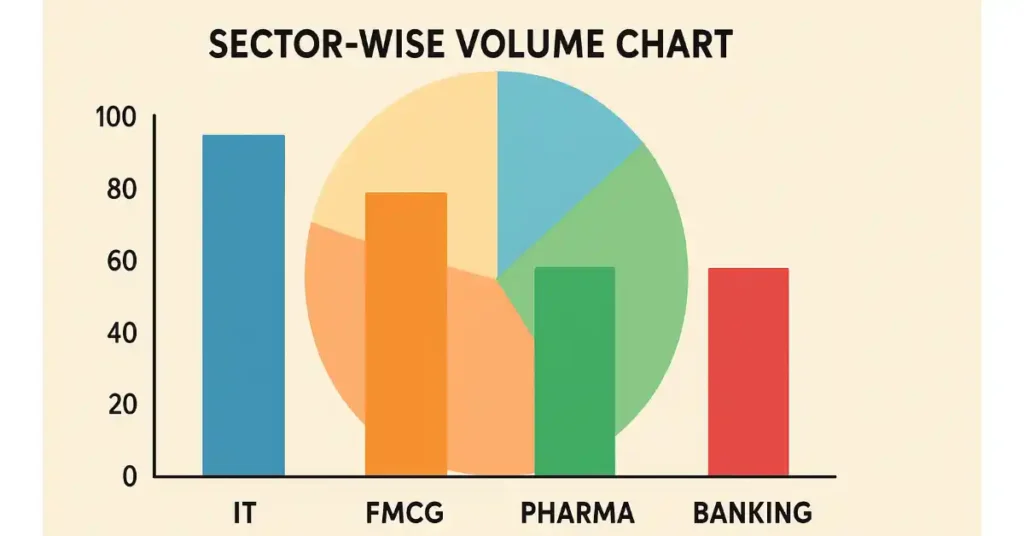
Different sectors में volume patterns अलग होते हैं।
- IT Sector: High volatility; quarterly results volume spike
- FMCG: Steady volume; accumulation zones
- Pharma: News-driven spikes; trend confirmation
- Banking/PSU: High liquidity; institutional activity
Sector-wise analysis portfolio diversify करने और risk minimize करने में मदद करता है। Traders sector trends और volume spikes monitor करके profitable trades plan कर सकते हैं। Certain sectors में volume spike early signal देता है।
Psychology Behind Volume
Volume spikes अक्सर market sentiment बदलने का संकेत देते हैं।
- Retail vs institutional investors का behavior
- Fear, greed, earnings, news → sudden volume spikes
- Proper psychology समझकर profitable entry और exit points identify किए जा सकते हैं
Volume analysis emotion-driven decisions avoid करने में मदद करता है। High volume moves trend reversal या continuation confirm करते हैं। Traders market psychology और volume relation समझकर better strategy बना सकते हैं।
Volume Analysis Mistakes & Myths
Common mistakes:
- Sirf volume देखकर trade करना
- Low liquidity stocks over-rely करना
- Ignore divergence
- Overreact short-term fluctuations
- High volume always bullish → Myth
Proper volume analysis false breakouts और reversals avoid करने में मदद करता है। Accurate analysis से entry/exit timing improve होती है। Beginners को trading mistakes कम करने के लिए volume indicators और price action combine करना चाहिए।
Tools & Platforms for Volume Analysis
Top tools:
- TradingView: OBV, CMF, Volume Profile, VWAP
- Zerodha Kite: Volume bars, moving averages
- Upstox Pro: Charts + Volume indicators
- MetaTrader / Nifty Tools: Advanced analysis
Proper tools use करके trend confirmation, entry/exit points और risk management improve होता है। Indicators combine करके trading decisions accurate और profitable बनती हैं। Beginners और experienced traders दोनों tools effectively use कर सकते हैं।
Case Studies / Real-Life Examples
- XYZ Stock: ₹500 → ₹550, High volume + OBV → Strong bullish
- ABC Stock: ₹1000 → ₹950, High volume + CMF negative → Bearish
- Intraday Example: 5-min chart + high volume spike → Quick entry, low volume pullback → Exit
Real-life examples दिखाते हैं कि volume analysis कैसे trading decisions improve करता है। Volume spikes, divergence और accumulation/distribution zones identify करने से profit potential maximize होता है।
Step-by-Step Action Plan for Traders
- High liquidity stocks identify करें
- Daily और average volume analyze करें
- Price-volume relationship check करें
- Candlestick patterns + volume confirm करें
- Relative volume देखें
- Breakout/pullback/divergence strategies apply करें
- Sector-wise portfolio analyze करें
- Tools: OBV, VWAP, CMF, Volume Profile use करें
- Mistakes avoid करें
- Real-life charts + backtesting practice करें
Proper step-by-step approach से beginners और experienced traders दोनों profitable trading कर सकते हैं। Entry और exit points accurate होते हैं।
FAQs
Q1: Volume analysis beginner के लिए क्यों जरूरी है?
A: Volume analysis trend confirm करता है और trading decisions आसान बनाता है। High/low volume spikes market sentiment और potential entry/exit points दिखाते हैं।
Q2: क्या sirf volume देखकर trade कर सकते हैं?
A: नहीं, volume केवल confirmation tool है। Price action, candlestick patterns और trendlines combine करना जरूरी है। यह false breakouts और reversals avoid करने में मदद करता है।
Q3: High volume हमेशा bullish होता है?
A: नहीं, volume alone trend direction नहीं बताता। Price movement और market context देखना जरूरी है। High volume downtrend signal भी दे सकता है।
Q4: Intraday में volume कैसे use करें?
A: Intraday trading में high volume breakouts और low volume pullbacks entry/exit points determine करने के लिए useful हैं। Relative volume monitor करके unusual trading activity detect करें।
Q5: Long-term investing में volume का role क्या है?
A: Long-term investors accumulation/distribution zones और institutional activity monitor करते हैं। Volume trends confirm करते हैं कि stock stable है और growth potential रखता है।
Q6: Relative volume क्या है?
A: Relative volume = Current volume ÷ Average volume। >1 indicate करता है unusual interest, <1 low trading interest, trend confirmation में मदद करता है।
Q7: OBV indicator क्या है?
A: OBV (On-Balance Volume) cumulative indicator है। यह price और volume relation दिखाता है। High OBV → buying pressure, Low OBV → selling pressure।
Q8: VWAP indicator क्यों important है?
A: VWAP intraday average price indicator है। Entry/exit, trend confirmation और institutional activity identify करने में useful।
Q9: Candlestick patterns में volume क्यों जरूरी है?
A: Candlestick alone misleading हो सकते हैं। Volume confirm करने से pattern reliable होता है और trend की strength समझ आती है।
Q10: Breakout strategy में volume कैसे use करें?
A: Support/resistance break + high volume → strong entry signal। Stop-loss breakout level के नीचे रखें। High volume trend confirm करता है।
Q11: Pullback strategy में volume role क्या है?
A: Low volume retrace indicate करता है trend continuation। Entry points accurately identify करने के लिए high-volume confirmation देखें।
Q12: Volume divergence क्या है?
A: Price और volume opposite move करें → trend reversal signal। High price + low volume → weak trend, reversal possible।
Q13: Sector-wise volume analysis क्यों जरूरी है?
A: Different sectors में volume pattern अलग होता है। Sector-wise trends, liquidity और institutional activity identify करने में मदद करता है।
Q14: Mistakes avoid करने के लिए क्या करें?
A: Sirf volume पर rely न करें। Low liquidity, divergence ignore न करें। Price-volume combined strategy use करें।
Q15: Institutional vs retail volume कैसे पता करें?
A: Large block trades और unusual spikes institutional activity दिखाते हैं। Retail volume small trades में reflect होता है।
Q16: Accumulation/Distribution zones क्या हैं?
A: ये zones indicate करते हैं कि stock को buy/sell किया जा रहा है। High volume accumulation → bullish, distribution → bearish।
Q17: Intraday vs swing trading volume difference क्या है?
A: Intraday में minute-level volume spikes monitor होते हैं। Swing में daily/weekly volume trends focus। Entry/exit timing अलग होती है।
Q18: Tools और platforms कौन-कौन से use करें?
A: TradingView, Zerodha Kite, Upstox Pro, MetaTrader। Indicators: OBV, CMF, VWAP, Volume Profile। Trend confirmation में मदद करते हैं।
Q19: Real-life examples क्यों study करें?
A: Real-life examples market behavior, trend confirmation और volume spike impact समझने में मदद करते हैं। Beginners practical experience सीखते हैं।
Q20: Consistent volume analysis करने से क्या फायदा है?
A: Trend reliability समझना, entry/exit accuracy improve करना, false breakouts avoid करना और overall trading profits maximize करना।
Conclusion
Volume Analysis एक powerful और essential tool है। Price के साथ combine करके यह:
- Trend की strength समझने में मदद करता है
- Breakouts और reversals detect करता है
- Risk reduce और profit potential maximize करता है
Traders beginners और experienced दोनों consistent practice और charts + volume indicators का सही use करके profitable trading कर सकते हैं। Intraday, swing या long-term investing में proper volume analysis trading decisions accurate बनाता है।
Volume spikes, divergence, accumulation/distribution zones और sector-wise trends monitor करके entry और exit points optimize होते हैं। Volume + price + candlestick combination से risk कम और profits maximize होते हैं।
Disclaimer
इस ब्लॉग में दी गई जानकारी केवल शैक्षिक और सूचनात्मक उद्देश्यों के लिए है। यहाँ दी गई कोई भी जानकारी निवेश या ट्रेडिंग के लिए प्रत्यक्ष सलाह नहीं है।
Stock Market में निवेश और ट्रेडिंग में संपत्ति का मूल्य बढ़ने या घटने का जोखिम हमेशा होता है। लेखक या वेबसाइट किसी भी हानि, नुकसान या वित्तीय जोखिम के लिए जिम्मेदार नहीं होंगे जो इस ब्लॉग की जानकारी के आधार पर हो।
कृपया अपने निवेश निर्णय लेने से पहले स्वतंत्र वित्तीय सलाहकार से परामर्श करें और स्वयं रिसर्च करें। Past performance future results की guarantee नहीं होती।

