
Live market analysis कैसे करें? Step-by-step guide, strategies, tools और tips जो beginners और experienced traders के लिए best हैं।
Introduction – Live Market Analysis
Stock market में success सिर्फ सही stock select करने में नहीं है। सबसे जरूरी skill है live market analysis। Live market analysis से आप current price trends, volume, और market sentiment समझकर better decisions ले सकते हैं।
Live market analysis beginners और experienced traders दोनों के लिए जरूरी है। Daily trends और price movements monitor करने से intraday और positional trades में accuracy बढ़ती है।
Tools और strategies के सही use से आप risk कम और profit maximize कर सकते हैं। Real-time data जैसे NSE/BSE prices, FII/DII activity, corporate announcements trading decisions में मदद करते हैं।
इस guide में हम cover करेंगे: Live market analysis kya है, best tools, strategies, technical indicators, pre-market trends, intraday strategies, sectoral analysis, risk management, और FAQs।
What is Live Market Analysis
Live market analysis मतलब है real-time stock data और trends observe करना। यह intraday trading और long-term investing दोनों के लिए जरूरी skill है।
Price action analysis से current stock movement समझा जा सकता है। Volume analysis high liquidity और strong interest वाले stocks identify करने में मदद करता है। Market sentiment analysis से पता चलता है कि market bullish है या bearish।
Live market analysis से आप trend reversal, breakout, और support/resistance levels जल्दी पहचान सकते हैं। Candlestick patterns और chart formations इसमें अहम role play करते हैं।
Real-time market monitoring tools जैसे TradingView, Zerodha Kite, Upstox Pro analysis में accuracy बढ़ाते हैं।
Investors और traders के लिए यह skill critical है क्योंकि sudden news या global market changes instantly affect कर सकते हैं। Proper live market analysis से entry और exit points structured और profitable बनते हैं।
Importance of Live Market Analysis for Beginners
Beginners के लिए live market analysis सीखना बहुत जरूरी है। यह उन्हें market structure, stock behavior और risk management समझने में मदद करता है।
Live analysis से beginners सीखते हैं कि कौन से stocks high volume और liquidity वाले हैं, और कौन से sectors trending हैं। यह knowledge trading mistakes को कम करता है।
Intraday trading में सही decisions लेने के लिए price action, technical indicators और news impact का समझ होना जरूरी है। Pre-market trends और gainers/losers list monitor करना beginners के लिए fundamental skill है।
Market volatility और sudden price swings beginners के लिए challenge होते हैं। Live market analysis से वे structured approach adopt कर सकते हैं और impulsive decisions avoid कर सकते हैं।
Technical indicators जैसे RSI, MACD, Moving Average beginners को entry और exit points identify करने में मदद करते हैं।
Stock Market Apps & Platforms for Live Analysis
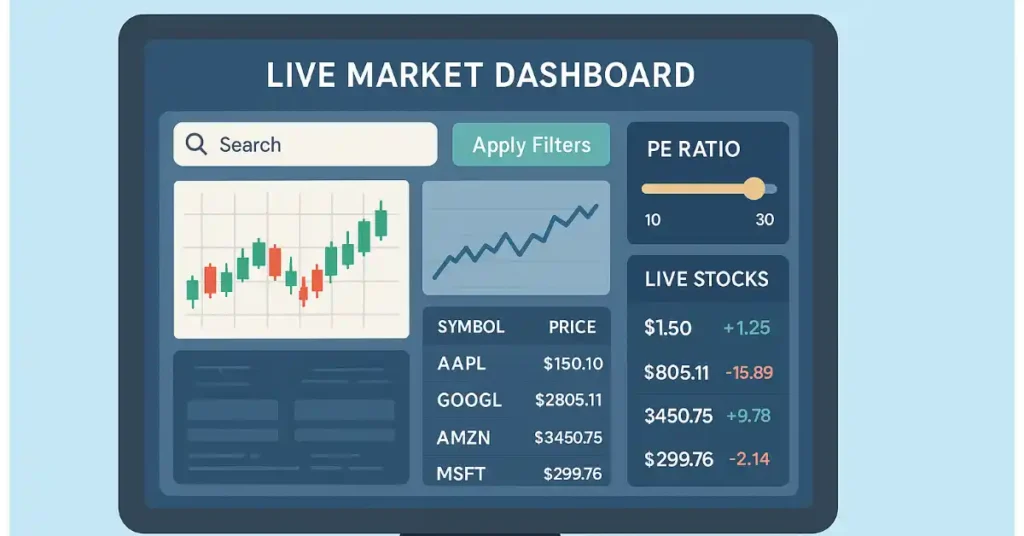
Live market analysis के लिए सबसे पहले सही tools और platforms चाहिए। Top apps और platforms traders और investors को real-time prices, charts और alerts provide करते हैं।
TradingView: Advanced charting, indicators, और drawing tools। Multi-timeframe analysis possible।
Moneycontrol/NSE India: Real-time stock prices और corporate news।
Zerodha Kite/Upstox Pro: Live market dashboard, order placement और technical charts।
Mobile apps convenience provide करते हैं, desktop platforms advanced tools और visualization में strong होते हैं।
Free vs paid tools comparison: Paid tools में ज्यादा features, alerts और historical data available होते हैं। Beginners free tools से start कर सकते हैं और advanced traders paid tools use करते हैं।
Market analysis apps से stock screening, top gainers/losers और high volume stocks monitor करना आसान होता है।
Technical Indicators for Live Market Analysis
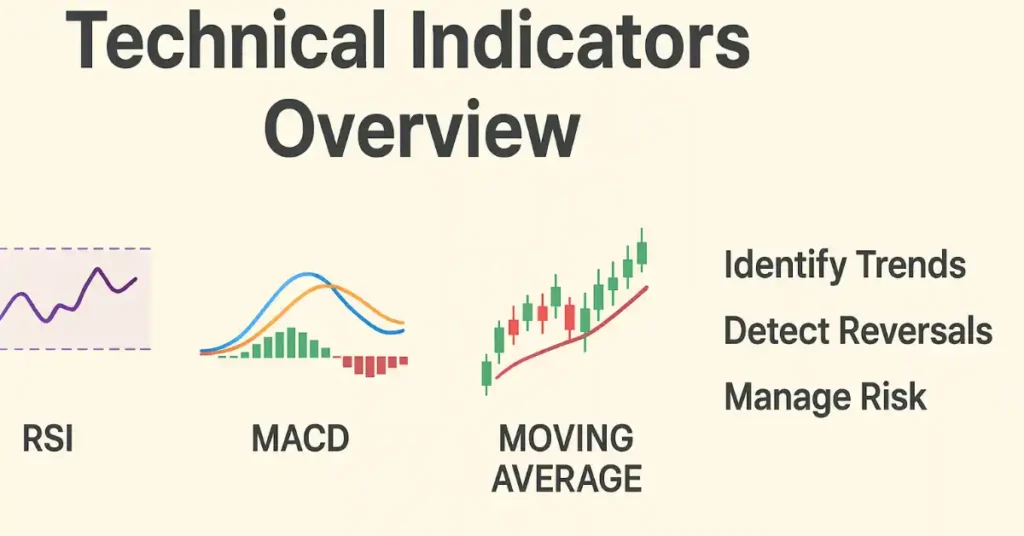
Technical indicators real-time market analysis का backbone हैं। Price trends, momentum और reversal points detect करने में मदद करते हैं।
Moving Average (MA): Trend smoothing और support/resistance identify करने में help करता है।
RSI (Relative Strength Index): Overbought और oversold conditions दिखाता है।
MACD (Moving Average Convergence Divergence): Momentum और trend reversal identify करता है।
Bollinger Bands: Volatility और price breakout levels identify करने के लिए।
Fibonacci Retracement: Support/resistance levels और trend reversal estimate करने के लिए।
Multiple indicators combination से signal accuracy बढ़ती है। Overload से confusion हो सकता है। Best practice: 2-3 main indicators use करें।
Candlestick Patterns & Price Action
Candlestick patterns और price action analysis से market direction समझा जा सकता है। Doji, Hammer, Engulfing जैसे patterns short-term और intraday trading में critical हैं।
Price action strategy में entry, exit, stop loss और target points plan किए जाते हैं। Support और resistance levels price action के basis पर identify होते हैं।
High volume और trending stocks पर price action analysis effective रहता है। Daily charts और multi-timeframe analysis से trend reversal points जल्दी पकड़ सकते हैं।
Candlestick patterns beginners और advanced traders दोनों के लिए visual representation provide करते हैं।
Step-by-Step Guide to Live Market Analysis
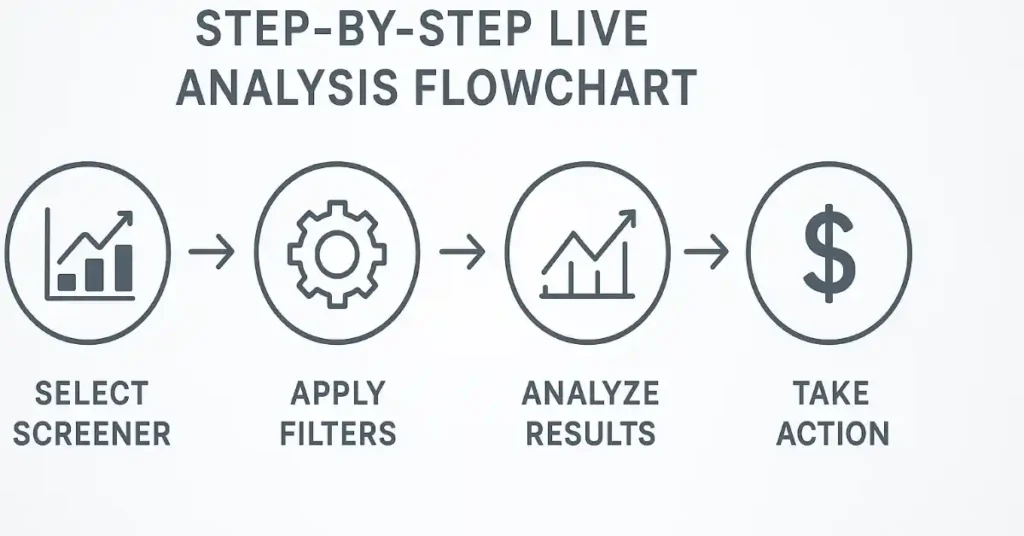
Step 1: Market open होने से पहले top gainers और losers check करें।
Step 2: Pre-market trends और price gaps analyze करें।
Step 3: Intraday trend analysis में candlestick और support/resistance levels check करें।
Step 4: RSI, MACD, Moving Average indicators से entry/exit signals identify करें।
Step 5: Real-time news, corporate announcements और global indices monitor करें।
Step 6: Stop loss और target price set करें। Risk management और position sizing अपनाएं।
Structured approach से impulsive decisions avoid होते हैं। Real-time data और multiple indicators combination से accuracy बढ़ती है।
Intraday Trading Strategies
Intraday trading में traders same day में stocks buy और sell करते हैं। इसका main goal है short-term price movements से profit capture करना। Momentum trading में high volume और trending stocks पर focus करें। RSI और MACD momentum track करने में मदद करते हैं।
Breakout trading में support या resistance levels break होने पर trade करें। High volume breakout strong trend indicate करता है। Scalping strategy में small price movements से multiple trades execute होती हैं। Fast decision-making और high liquidity required होती है।
Pre-market preparation critical है। Market open होने से पहले top gainers, losers और futures data देखें। Early entry opportunities detect होती हैं।
Risk management essential है। Stop loss और target price strictly follow करें। Overtrading और impulsive decisions avoid करें। Position size और capital allocation सही रखें।
Intraday strategies beginners और advanced traders दोनों के लिए effective हैं। Real-time charts और alerts trade execution को accurate बनाते हैं।
Swing Trading Strategies
Swing trading medium-term strategy है। Trades 2–7 दिन या कुछ हफ्तों तक hold किए जाते हैं। Trend और momentum indicators swing trading में entry/exit points identify करने में मदद करते हैं।
Trend following approach में moving averages, MACD और RSI use करें। Uptrend में buy और downtrend में sell trades करें। Support और resistance levels entry और exit के लिए critical हैं।
Fibonacci retracement levels retracement points identify करने में मदद करते हैं। High volume और liquid stocks select करना essential है। Low liquidity stocks में price manipulation और gaps का risk ज्यादा होता है।
Risk management critical है। Stop loss और target price set करें। Capital allocation और emotional discipline maintain करना long-term profitability के लिए जरूरी है।
Sectoral trends और corporate announcements swing trading performance affect करते हैं। Beginners और experienced traders दोनों strategy adopt कर सकते हैं।
Sectoral & Stock Analysis
Sectoral analysis traders को दिखाता है कि कौन सा sector strong और weak है। Top performing sectors: IT, Banking, Pharma, Auto। Sector rotation और FII/DII activity monitor करें।
Stock selection में fundamentals check करें: P/E ratio, EPS growth, debt ratio, dividend yield। High growth और liquid stocks intraday और swing trading के लिए ideal हैं।
Top gainers और losers list monitor करें। यह short-term trading opportunities detect करने में मदद करती है। Sector rotation observe करने से long-term trend का idea मिलता है।
Technical analysis और charting tools combination से entry और exit points improve होते हैं। Live news और corporate announcements sectoral performance instantly affect करते हैं।
High Volume & Liquid Stocks Selection
High volume और liquid stocks intraday और swing trading के लिए सबसे suitable हैं। High liquidity मतलब easy entry और exit। Low liquidity stocks में slippage और price manipulation का risk ज्यादा होता है।
Volume analysis critical है। High volume spikes observe करें। Market depth और order book analysis F&O traders के लिए critical है।
Sector और stock screening tools जैसे TradingView, Screener.in और Chartink use करें। Entry और exit points identify करें। Stop loss और target levels strictly follow करें।
High volume और liquid stocks selection beginners और advanced traders दोनों के लिए profitable trading ensure करता है।
Pre-Market and Post-Market Analysis
Pre-market analysis से trend और price gaps identify होते हैं। Top gainers, losers, futures data और global indices pre-market trends detect करने में मदद करते हैं।
Post-market analysis में daily trend review करें। Gain/loss stocks, sectoral performance और corporate announcements analyze करें। यह next day trading strategy plan करने में मदद करता है।
Global market impact, FII/DII activity और overnight news pre/post-market trends affect करते हैं। Daily charts review करके support/resistance levels और breakout points check करें।
Pre/post-market analysis structured approach adopt करने और impulsive decisions avoid करने में मदद करता है।
Real-Time News & Alerts Impact
Real-time news instant price impact डालती है। Economic calendar, corporate results, IPO announcements और F&O expiry monitor करें।
Market sentiment news और social media से पता चलता है। Bullish या bearish sentiment identify करें। Corporate results short-term trading opportunities provide करते हैं।
Global news, oil prices, interest rate changes और geopolitical events market impact करते हैं। Mobile alerts और notifications sudden opportunities detect करने में मदद करते हैं।
Real-time news combine करें technical indicators और chart patterns के साथ। Stop loss और target price update करना trading accuracy बढ़ाता है।
Futures & Options Chain Analysis
Futures और options chain market sentiment और key levels समझने में मदद करती है। Open interest, strike price और expiry data critical हैं।
Support और resistance levels F&O analysis से identify होते हैं। High open interest strong trend indicate करता है।
Options strategies जैसे covered call और protective put risk mitigate करने में मदद करते हैं। High liquidity F&O contracts select करें। Low liquidity contracts में slippage और risk बढ़ता है।
Futures और options trends monitor करके entry/exit timing improve होती है। Volatility और premium trends track करना advanced traders के लिए essential है।
Risk Management & Money Management Techniques
Risk management trading में critical skill है। Stop loss, target price और trailing stop set करें।
Capital allocation और position sizing trade strategy और risk tolerance के हिसाब से रखें। Overexposure avoid करें। Emotional discipline maintain करें।
Portfolio diversification multiple sectors और asset classes में risk spread करता है। Trading journal maintain करके past mistakes analyze करें और strategy improve करें।
Proper risk management intraday, swing और positional trading में profits maximize करती है। Beginners और advanced traders structured approach adopt करें।
Common Mistakes in Live Market Analysis
Over-reliance on single indicator, ignoring corporate news और poor risk management सबसे common mistakes हैं।
Overtrading और emotional decisions impulsive losses बढ़ाते हैं। Volume trends और liquidity ignore करना भी गलत है।
Improper technical analysis और candlestick patterns misunderstanding mistakes बढ़ाती हैं। Structured approach, proper risk management और real-time analysis से mistakes minimize होती हैं।
Advanced traders multiple verified sources और tools use करते हैं। Beginners को focus और discipline maintain करना चाहिए।
Advanced Charting & Visualization Tools
Advanced charting tools जैसे TradingView और Chartink market trends, multi-timeframe analysis और candlestick patterns track करने में मदद करते हैं।
Trend analysis, support/resistance, volume और momentum indicators trading decisions improve करते हैं। Alerts, templates और historical data advanced traders के लिए critical हैं।
Charts visualization से market pattern recognition आसान होता है। High volume और trending sectors monitor करना structured approach provide करता है।
Market Sentiment Analysis
Market sentiment traders का bullish या bearish mood दिखाता है। News, social media और forums sentiment gauge करने में मदद करते हैं।
Economic, corporate और geopolitical news sentiment प्रभावित करती हैं। Social media platforms traders का mood और crowd behavior reveal करते हैं।
FII/DII activity fund flow से market sentiment समझने में मदद करता है। Market sentiment को technical indicators और price action के साथ combine करें। Structured approach impulsive trades avoid करती है।
Bullish sentiment में buy और bearish में sell trades execute करें। Multiple sentiment sources track करना trading decisions accurate बनाता है।
FAQs
Q1: Live market analysis beginners के लिए क्यों जरूरी है?
A1: Beginners को trends, price movements और charts समझने में मदद मिलती है। यह intraday और long-term investing में सही decisions लेने में मदद करता है।
Q2: सिर्फ technical analysis पर्याप्त है?
A2: नहीं, fundamentals और news का effect भी consider करना जरूरी है। Combined approach से accurate trading decisions मिलते हैं।
Q3: Intraday trading के लिए best stocks कौनसे हैं?
A3: High liquidity, high volume और stable trend वाले stocks intraday trading के लिए ideal हैं।
Q4: RSI indicator का use कैसे करें?
A4: RSI से overbought (70+) और oversold (30-) stocks identify करें। Entry और exit signals में मदद करता है।
Q5: MACD क्यों जरूरी है?
A5: MACD trend momentum और reversal identify करने में मदद करता है। यह moving average difference पर आधारित है।
Q6: Moving Average कैसे काम करता है?
A6: Moving Average trend smoothing करता है। Long-term और short-term trends identify करने में मदद करता है।
Q7: Pre-market analysis क्यों करें?
A7: Pre-market trends और price gaps identify करने से intraday opportunities जल्दी पकड़ सकते हैं।
Q8: Gainers और losers list कैसे use करें?
A8: यह high potential और weak stocks identify करने में मदद करती है। High volume और trending stocks पर focus करें।
Q9: Futures और Options chain क्यों check करें?
A9: F&O chain से market sentiment और key support-resistance levels समझ सकते हैं।
Q10: Market news monitor क्यों जरूरी है?
A10: Sudden news या events stock prices को instantly प्रभावित करते हैं। सही decisions लेने के लिए news monitor करें।
Q11: Stop loss क्यों set करें?
A11: Loss minimize करने और risk manage करने के लिए stop loss जरूरी है।
Q12: Risk management trading में कैसे करें?
A12: Position sizing, diversification और stop loss से risk control करें।
Q13: Candlestick patterns क्या हैं?
A13: Price movements visualize करने का तरीका। Doji, Hammer, Engulfing main patterns हैं।
Q14: Market sentiment क्या है?
A14: Traders का bullish या bearish mood दिखाता है। News और social media से gauge कर सकते हैं।
Q15: High volume stocks क्यों choose करें?
A15: High volume stocks में liquidity ज्यादा होती है। Entry और exit आसानी से कर सकते हैं।
Q16: Technical indicators कितने इस्तेमाल करें?
A16: 2-3 main indicators sufficient हैं। Overload से confusion और wrong decisions हो सकते हैं।
Q17: Free vs Paid tools क्या difference है?
A17: Paid tools में ज्यादा features, real-time alerts और advanced charts होते हैं। Beginners free tools से start कर सकते हैं।
Q18: Historical data क्यों study करें?
A18: Historical data past trends दिखाता है। Trend reversal और breakout points identify करने में मदद करता है।
Q19: Trading journal maintain क्यों करें?
A19: Trading journal mistakes track करने और strategy improve करने में मदद करता है।
Q20: Real-time stock analysis क्यों important है?
A20: Real-time analysis instant decisions लेने में मदद करता है। Market movement जल्दी पकड़ सकते हैं और profit maximize कर सकते हैं।
Conclusion
Live market analysis एक skill है जो practice और patience से improve होती है।
- Step-by-step approach adopt करें।
- Right tools और indicators use करें।
- Risk management और structured decisions लें।
- Pre-market और intraday trends analyze करें।
Beginners और advanced traders दोनों के लिए यह strategy profitable और efficient है। Market trends, corporate news और technical indicators को combined तरीके से use करना trading accuracy बढ़ाता है।
High volume और liquid stocks monitor करें। Candlestick patterns, moving averages, RSI, MACD और breakout points consistently analyze करें। Emotional discipline और impulsive trading avoid करें।
Pre/post-market analysis और real-time alerts trading decisions improve करते हैं। Futures और options chain analysis से market sentiment और entry/exit points better समझ सकते हैं।
Structured risk management, proper position sizing और capital allocation long-term profitability ensure करते हैं। Trading journal maintain करें, past mistakes analyze करें और strategy refine करें।
Live market analysis skill develop करने से आप informed trading decisions ले सकते हैं, impulsive mistakes avoid कर सकते हैं और sustainable profits generate कर सकते हैं।
Disclaimer
यह ब्लॉग केवल educational और informational purposes के लिए है। इसमें दी गई जानकारी financial advice नहीं है। Stock market में trading और investment करने से पहले अपने financial advisor या certified professional से सलाह लेना जरूरी है।
Stock market high-risk environment है और इसमें capital loss का जोखिम हमेशा मौजूद रहता है। इस ब्लॉग में दी गई strategies, tools, indicators और tips सिर्फ learning और awareness के लिए हैं।
हम किसी भी financial loss या trading decision के लिए जिम्मेदार नहीं हैं। Readers से request है कि apni research और due diligence के बाद ही investment या trading decisions लें।