

Double Top and Double Bottom Pattern का complete guide। Pattern formation, breakout strategies, volume analysis, multi-timeframe confirmation.
Introduction: Double Top and Double Bottom Pattern
Trading और investing में price patterns market behavior समझने का सबसे आसान तरीका हैं। Price movement random नहीं होता। यह traders की psychology, supply-demand और market sentiment के कारण predictable होता है।
Double Top और Double Bottom दो सबसे popular और reliable reversal patterns हैं। Double Top bearish reversal signal देता है, जब market uptrend के बाद गिरता है। Double Bottom bullish reversal signal है, जब downtrend के बाद price bounce करता है।
Psychology समझना जरूरी है। Double Top में greed और overconfidence नए highs chase करते हैं, लेकिन दूसरा peak fail होने पर fear बढ़ता है और market गिरता है। Double Bottom में first low पर panic selling होती है, लेकिन buying interest build होता है और second low failure पर confidence बढ़ता है।
Volume और trend confirm करने के लिए indicators जैसे RSI, MACD और Bollinger Bands जरूरी हैं। Multi-timeframe analysis जैसे daily और weekly charts pattern की reliability बढ़ाते हैं। Short-term charts intraday entry और exit guide करते हैं।
इस guide में step-by-step pattern formation, trading strategies, volume confirmation, indicators, real-life examples और risk management समझाया गया है। Pattern recognition, breakout points और profit target calculation सीखकर आप trading में consistency और discipline ला सकते हैं।
Double Top Pattern

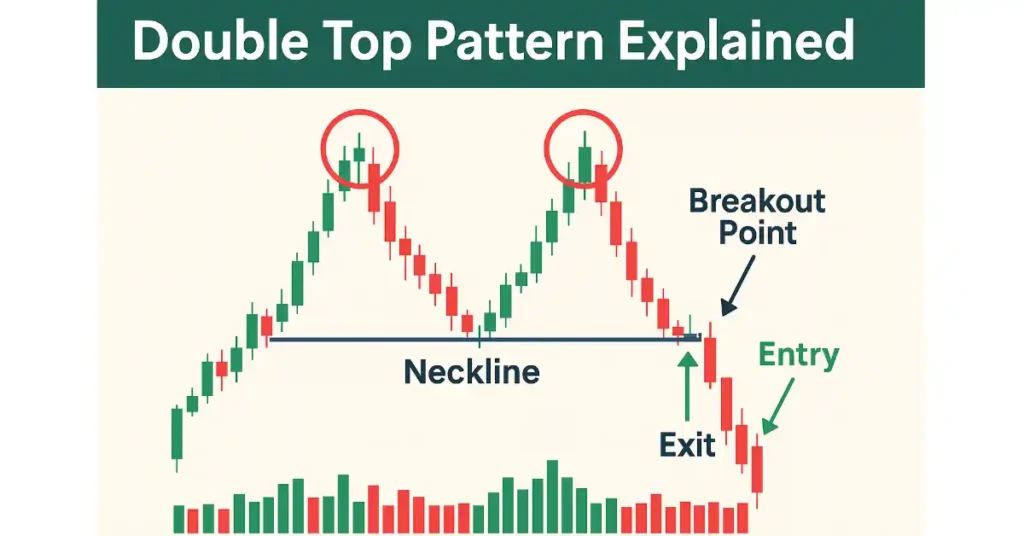
Double Top एक bearish reversal pattern है। Market दो बार resistance level तक जाता है और नीचे गिरता है। यह pattern stocks, forex और crypto trading में सबसे reliable reversal signal माना जाता है।
Key Features:
- दो peaks समान level पर
- Peaks के बीच dip
- Volume में पहला peak high और दूसरा peak low
- Neckline break → sell signal
Formation Steps:
- Uptrend में price resistance level तक बढ़ता है
- Price वापस dip करता है
- दोबारा resistance test करता है लेकिन fail होता है
- Neckline break → short/sell trade
Trading Strategy:
- Entry: Neckline break पर short
- Stop Loss: Second peak के ऊपर
- Target: Peak से neckline तक distance
Indicators:
- RSI divergence → overbought confirmation
- MACD → trend reversal
- Bollinger Bands → upper band touch pattern confirm
Volume Confirmation:
- 1st peak → high volume
- 2nd peak → low volume
- Breakout → high volume sell signal
Real-Life Example:
Nifty 18,000 → 17,800 → 18,000 fail → break 17,800 → sell। Volume और multi-timeframe confirmation trade reliability बढ़ाते हैं।
Double Top pattern identify करना आसान है, लेकिन false breakout और impulsive trade से बचने के लिए हमेशा indicators और stop loss use करें। Pattern analysis + psychology समझना profitable trading में मदद करता है।
Double Bottom Pattern
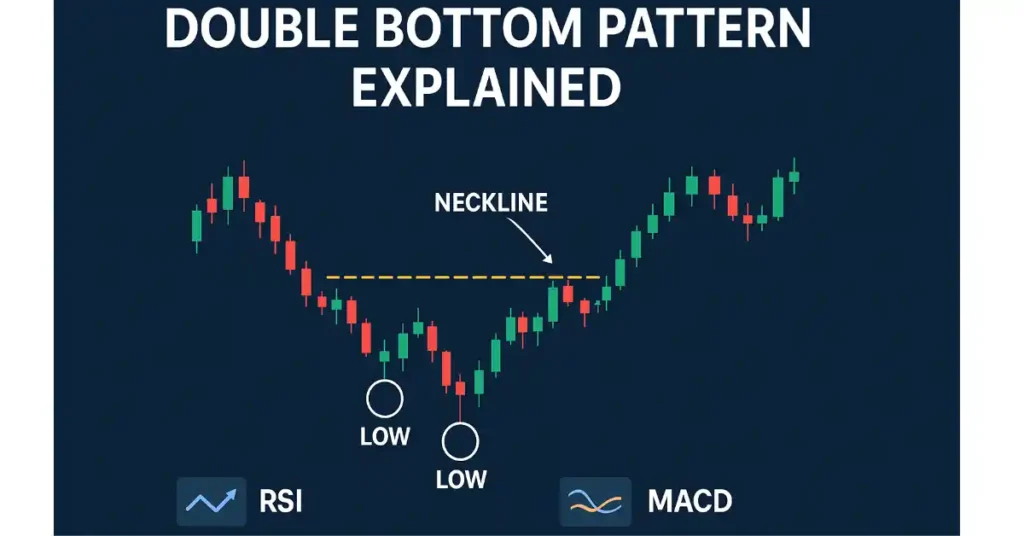
Double Bottom bullish reversal pattern है। Market दो बार support level touch करता है और ऊपर bounce करता है। यह pattern stocks, crypto, forex और commodities में use होता है।
Key Features:
- दो lows समान support पर
- Lows के बीच peak
- Volume: 1st low low, 2nd low high
- Breakout above neckline → buy signal
Formation Steps:
- Downtrend में price support तक गिरता है
- Bounce होता है
- दोबारा support test करता है
- Neckline break → bullish reversal
Trading Strategy:
- Entry: Neckline break → buy
- Stop Loss: Second low के नीचे
- Target: Neckline से peak तक distance
Indicators:
- RSI oversold → buy signal
- MACD bullish crossover
- Fibonacci retracement → target projection
Volume Confirmation:
- 1st low → low volume
- 2nd low → high volume
- Breakout → high volume confirms buy
Example:
Reliance 2,500 → 2,550 → 2,500 → breakout 2,550 → buy। Volume और indicators confirm होने पर trade probability high होती है।
Double Bottom identify करना आसान है, लेकिन fake breakout और impulsive trading से बचना चाहिए। Multi-timeframe charts (daily + weekly) confirm होने पर pattern reliability और strong signal देती है।
Differences Between Double Top & Double Bottom
Double Top और Double Bottom में मुख्य अंतर trend और signal type में होता है। Double Top uptrend के बाद bearish reversal है और Double Bottom downtrend के बाद bullish reversal।
| Feature | Double Top | Double Bottom |
|---|---|---|
| Trend before pattern | Uptrend | Downtrend |
| Signal type | Bearish reversal | Bullish reversal |
| Price peaks/lows | Two highs | Two lows |
| Volume trend | 1st peak high, 2nd low | 1st low low, 2nd high |
| Trade entry | Neckline break → sell | Neckline break → buy |
Double Top selling opportunity देती है और Double Bottom buying opportunity। Multi-timeframe charts pattern confirm होने पर strong signal देते हैं। Volume और trend indicators pattern की reliability बढ़ाते हैं। Traders हमेशा stop loss और profit target use करें।
Volume Confirmation
Volume analysis trading में pattern की strength दिखाने का सबसे आसान तरीका है। Double Top में 1st peak high volume, 2nd peak low volume और breakout high volume sell signal है। Double Bottom में 1st low low volume, 2nd low high volume और breakout high volume buy signal है।
Volume ignore करने पर false breakout या unreliable pattern दिखाई देता है। Price action + volume confirm trade reliability बढ़ाते हैं। Indicators जैसे RSI, MACD और Bollinger Bands pattern confirmation में मदद करते हैं।
Volume + pattern + multi-timeframe analysis combine करने से false trades avoid होते हैं। Traders high probability trades के लिए always volume confirmation देखें।
Multi-Timeframe Analysis
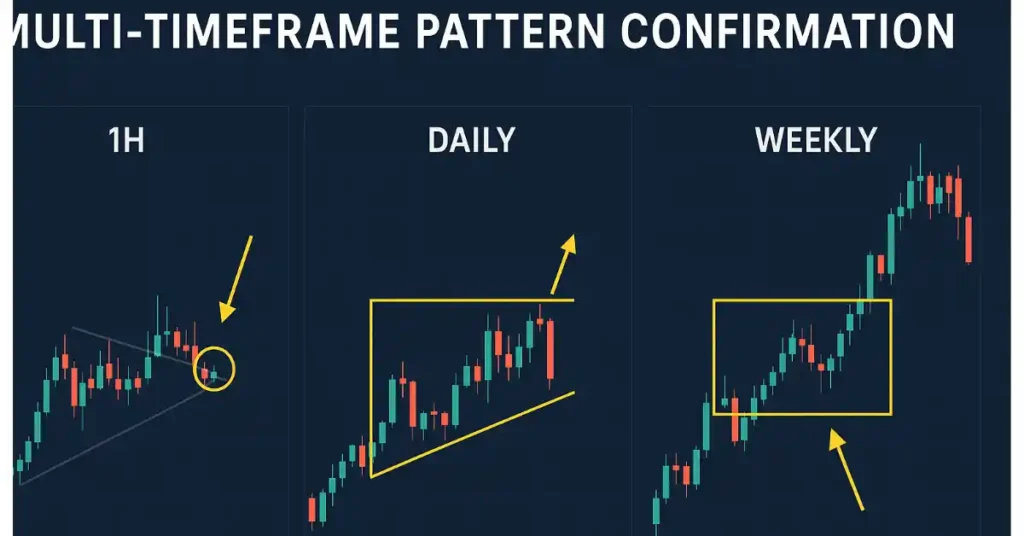
Trading में multi-timeframe analysis pattern की reliability बढ़ाने का सबसे effective तरीका है। Short-term, medium-term और long-term charts एक साथ देखने से आप entry और exit decisions बेहतर कर सकते हैं।
- Short-term charts (1H, 4H): Intraday trades के लिए useful। Pattern confirm होने पर small timeframe में entry और exit execute कर सकते हैं।
- Medium-term charts (Daily): Swing trading के लिए ideal। Daily chart trend direction और support/resistance levels confirm करता है।
- Long-term charts (Weekly): Position trading और overall trend analysis के लिए best। Weekly charts pattern strength और market sentiment दिखाते हैं।
Multi-timeframe analysis false breakout और impulsive trades से बचाता है। जब pattern short-term और long-term दोनों charts में confirm हो, तो trade probability high होती है।
Double Top और Double Bottom pattern दोनों में multi-timeframe analysis critical है। उदाहरण के लिए, एक Double Top pattern daily chart पर बन सकता है लेकिन weekly chart में trend confirm होना चाहिए। Similarly, Double Bottom breakout short-term में दिख सकता है लेकिन long-term trend bullish होने पर ही strong buy signal होता है।
Multi-timeframe analysis के साथ volume और indicators भी confirm करें। इससे pattern की strength और reliability increase होती है। Traders discipline और patience के साथ trading करें।
Indicators & Pattern Combination
Indicators pattern confirmation और false signal elimination में महत्वपूर्ण भूमिका निभाते हैं। Double Top और Double Bottom pattern analyze करते समय indicators integrate करना जरूरी है।
- RSI (Relative Strength Index): Overbought signal (Double Top) या Oversold signal (Double Bottom) confirm करता है। Divergence pattern identify करने में मदद करता है।
- MACD (Moving Average Convergence Divergence): Trend reversal को confirm करता है। Double Top में bearish crossover और Double Bottom में bullish crossover signal देता है।
- Bollinger Bands: Price upper band touch (Double Top) या lower band touch (Double Bottom) reversal pattern confirm करता है।
- Fibonacci Retracement: Target projection और support/resistance levels identify करने में useful।
Indicators को pattern के साथ combine करने से high probability trades मिलते हैं। Example: Double Bottom pattern + RSI oversold + MACD bullish crossover + breakout volume spike → strong buy signal।
False breakouts avoid करने के लिए multi-indicator confirmation जरूरी है। Single indicator पर trade करना risky हो सकता है। Indicators trend strength, momentum और entry-exit points define करने में मदद करते हैं।
Advanced traders algorithmic tools और AI pattern detection भी use करते हैं। Indicators + AI + volume confirmation combination से trading probability और profit potential बढ़ता है।
Profit Target & Risk Management
Trading में profit target और risk management critical हैं। Double Top और Double Bottom pattern analyze करते समय proper risk-reward ratio और stop loss strategy implement करनी चाहिए।
Price Target Calculation:
- Formula: Peak – Neckline = projected move
- Double Bottom: Neckline से peak तक projected move
- Risk:Reward ratio minimum 1:2 recommend किया जाता है
Stop Loss Placement:
- Double Top: Second peak के ऊपर
- Double Bottom: Second low के नीचे
Trailing Stop Loss: Profits protect करने के लिए effective। Breakout में market momentum strong हो तो trailing stop maintain करना recommended।
Risk Management Tips:
- Fake breakout पर impulsive trade avoid करें।
- Multi-timeframe और volume confirmation से trade probability बढ़ाएं।
- Single indicator पर भरोसा न करें।
- Discipline और patience maintain करें।
Proper risk management trading losses minimize करता है और profitable trades maximize करता है। Pattern analysis + indicators + volume + risk management strategy combine करने से traders high probability trades execute कर सकते हैं।
Real-Life Examples & Case Studies
Real-life examples pattern understanding को आसान बनाते हैं। Double Top और Double Bottom pattern stocks, crypto और commodities में अलग-अलग तरीके से appear होते हैं।
Example 1 – Nifty Double Top:
18,000 → 17,800 → 18,000 fail → breakout 17,800 → sell signal। Volume spike confirm। Daily और weekly chart trend align।
Example 2 – Reliance Double Bottom:
2,500 → 2,550 → 2,500 → breakout 2,550 → buy signal। RSI oversold और MACD bullish crossover pattern confirm।
Example 3 – Bitcoin Double Top:
50,000 → 48,000 → 50,000 fail → breakout 48,000 → bearish reversal. Multi-timeframe analysis और volume spike signal confirm।
Charts में peaks, lows, neckline और breakout arrows mark करने से visual understanding strong होती है। Traders example follow करके real market pattern identify करना सीख सकते हैं।
Real-life examples show करते हैं कि indicators, volume और multi-timeframe confirmation trade reliability बढ़ाते हैं। Impulsive trading और fake breakouts से बचने के लिए हमेशा example-based learning useful होती है।
Common Mistakes & Misconceptions
Double Top और Double Bottom pattern में common mistakes और misconceptions trading losses का कारण बनते हैं।
Common Mistakes:
- Fake breakout पर impulsive trade करना
- Volume ignore करना
- Stop loss न रखना
- Pattern incomplete होने पर trade करना
Misconceptions:
- Pattern हमेशा 100% accurate नहीं।
- Single indicator पर भरोसा करना risky है।
- Short-term chart में breakout confirm होना long-term trend का signal नहीं है।
Avoid करने के लिए: multi-timeframe confirmation, volume analysis और indicator confirmation use करें। Stop loss और profit target maintain करना जरूरी है। Discipline, patience और proper risk management profitable trading में key हैं।
Trading mistakes और misconceptions identify करके beginner और advanced traders अपने trading strategy improve कर सकते हैं। Pattern recognition + indicators + volume + risk management combination सबसे effective approach है।
Automated Pattern Detection & AI Tools
Advanced traders AI और algorithmic tools use करते हैं। Peaks, lows और breakout detection automated tools तेजी से करते हैं।
Advantages:
- Fast scanning across multiple charts
- Accurate pattern detection
- Alerts for breakout and trend reversal
Disadvantages:
- False signals possible
- Over-reliance dangerous
- Market sentiment हमेशा algorithm detect नहीं कर सकता
AI tools indicators, volume और multi-timeframe analysis के साथ combine होने पर high probability trades generate करते हैं। Example: AI detect Double Top → RSI + MACD + volume spike → strong sell signal।
Automated tools beginners और advanced traders दोनों के लिए time-saving और efficient हैं। लेकिन हमेशा manual confirmation, stop loss और risk management follow करें। Algorithmic trading pattern recognition में मदद करता है लेकिन human discretion essential है।
FAQs
- Double Top क्या है?
Double Top bearish reversal pattern है। Price दो बार resistance touch करता है और fail होने पर downtrend शुरू होता है। - Double Bottom क्या है?
Double Bottom bullish reversal pattern है। Price दो बार support touch करता है और ऊपर bounce करता है। - Double Top और Double Bottom कैसे पहचानें?
Peaks और lows identify करें, neckline draw करें, volume और trend confirm करें। Neckline break pattern signal देता है। - Stop loss कहाँ रखें?
Double Top → second peak ऊपर, Double Bottom → second low नीचे। - Profit target कैसे calculate करें?
Peak – Neckline = projected move; Risk:Reward minimum 1:2 रखें। - Volume क्यों जरूरी है?
Volume pattern की strength दिखाता है। Breakout में spike confirm signal है। - Pattern कितने समय में बनता है?
Hourly, daily या weekly charts में बन सकता है। - Crypto में काम करता है?
हाँ, pattern crypto, forex, stocks और commodities में apply होता है। - Indicators कौन से use करें?
RSI, MACD, Bollinger Bands, Fibonacci retracement। - Fake breakout कैसे avoid करें?
Volume और multi-timeframe confirmation देखें। Stop loss हमेशा रखें। - Double Top vs Head & Shoulders में फर्क?
Double Top दो peaks बनाता है; Head & Shoulders तीन peaks। दोनों bearish reversal हैं। - Trade कब exit करें?
Profit target या trailing stop loss पर exit करें। - Multi-timeframe analysis क्यों जरूरी?
Pattern short-term और long-term दोनों charts में confirm होना चाहिए। - Pattern हमेशा accurate होता है?
नहीं, volume, trend और indicators confirm होने पर reliability बढ़ती है। - Neckline क्या है?
Double Top → support line; Double Bottom → resistance line। Breakout trading signal है। - Entry point कैसे पता करें?
Neckline break confirm होने पर entry करें। - Double Top short-term trading कैसे करें?
1H/4H charts में pattern + volume + indicators confirm करें। - Double Bottom swing trading कैसे करें?
Daily chart trend confirm करें और neckline breakout पर buy करें। - Automated tools क्यों use करें?
Multi-chart detection और fast analysis के लिए। - Risk management क्यों जरूरी है?
Stop loss, target projection और proper risk:reward ratio losses control करते हैं।
Conclusion
Double Top और Double Bottom Pattern trading में सबसे popular और reliable reversal patterns हैं। Double Top bearish reversal signal देता है, जब price uptrend के बाद गिरने लगता है। Double Bottom bullish reversal signal है, जब downtrend के बाद price ऊपर bounce करता है।
Trading में success पाने के लिए pattern recognition, volume confirmation, multi-timeframe analysis और indicators का सही combination जरूरी है। RSI, MACD, Bollinger Bands और Fibonacci retracement जैसे tools pattern की reliability और trade probability बढ़ाते हैं। Volume analysis fake breakouts और impulsive trades से बचने में मदद करता है।
Profit target और risk management हमेशा ध्यान में रखें। Stop loss, trailing stop और proper risk:reward ratio trading को disciplined बनाते हैं। Multi-timeframe charts pattern की strength और trend direction confirm करते हैं। Real-life examples और case studies से pattern identify करना आसान होता है और market psychology समझ आती है।
Advanced traders AI और automated pattern detection tools use करके multiple charts analyze कर सकते हैं। लेकिन हमेशा manual confirmation, volume और risk management follow करना essential है। Pattern analysis, patience और discipline combined होने पर trading में consistency और profitable results मिलते हैं।
अंत में, Double Top और Double Bottom Pattern सीखना beginners और advanced traders दोनों के लिए जरूरी है। यह केवल charts पढ़ने का तरीका नहीं, बल्कि market psychology और trading strategy समझने का एक effective तरीका है। सही tools, indicators और strategies के साथ यह pattern trading में high probability opportunities प्रदान करता है।
Disclaimer
इस ब्लॉग में दी गई जानकारी केवल educational और informational purpose के लिए है। इसमें किसी भी प्रकार का financial, investment या trading advice नहीं है। Trading में निवेश करने से पहले अपने financial advisor से सलाह लें। लेखक या वेबसाइट किसी भी लाभ या हानि के लिए जिम्मेदार नहीं हैं।

