2025 में Stock Market में Swing Trading Indicators जैसे EMA, RSI, MACD और Bollinger Bands से हर trade में profit कमाने का secret जानें!
Introduction
स्विंग ट्रेडिंग (Swing Trading) एक Short-Term Trading स्टाइल है जिसमें ट्रेडर स्टॉक्स, ETFs और क्रिप्टो में छोटे समय में price movement का फायदा उठाते हैं। इसका मुख्य उद्देश्य Short-Term Profit Opportunities को पकड़ना है। Swing Trading Indicators का सही उपयोग करके आप 2025 में Stock Market में सुरक्षित और अधिक लाभदायक ट्रेड कर सकते हैं।
इस ब्लॉग में हम सीखेंगे कि कैसे EMA और RSI Trading, MACD Strategy, Bollinger Bands Breakout, Candlestick Patterns, Multi-Timeframe Analysis और Sector Rotation Strategy को combine करके Short-Term Profit Opportunities maximize की जा सकती हैं। साथ ही Risk Management, Automation Tools, Trading Psychology और Taxation जैसी महत्वपूर्ण बातें भी cover की जाएंगी।
What is Swing Trading?
स्विंग ट्रेडिंग एक ऐसा ट्रेडिंग स्टाइल है जिसमें पोज़िशन आमतौर पर 2–15 दिन तक रखी जाती है। इसका फोकस short-term price swings और trend पर होता है। ट्रेडर EMA, RSI और MACD जैसे Swing Trading Indicators का उपयोग करके entry और exit points identify करते हैं।
Short-Term Trading का फायदा यह है कि यह लंबे समय तक निवेश की तुलना में कम समय में प्रॉफिट generate करता है। इसमें trading alerts और automation tools का इस्तेमाल करके missed opportunities कम की जा सकती हैं। Swing Trading Beginners के लिए भी suitable है, यदि सही strategy और discipline अपनाया जाए। Fundamental data और market cycles को समझकर, traders sector rotation और short-term profit opportunities पहचान सकते हैं।
Swing Trading Indicators
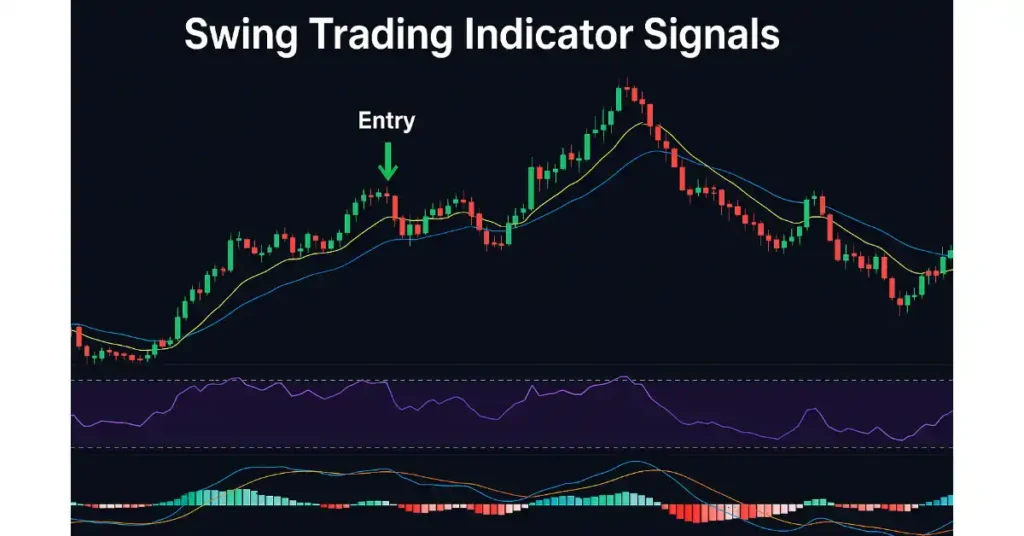
Swing Trading Indicators price trends और momentum identify करने में मदद करते हैं। EMA और SMA (Moving Averages) trend direction दिखाते हैं। EMA crossover strategy से Short-Term EMA Long-Term EMA को cross करने पर buy signal मिलता है। RSI (Relative Strength Index) 0–100 range में overbought (>70) और oversold (<30) conditions detect करता है।
MACD Strategy trend और momentum दोनों analyze करता है। Bollinger Bands Breakout volatility और price breakout को दिखाते हैं। Stochastic Oscillator short-term reversal signals देता है। Volume indicators trend strength confirm करते हैं। Fibonacci Retracement Levels entry और exit points के लिए उपयोगी हैं।
इन indicators को सही तरीके से combine करके swing traders profitable entry और exit points identify कर सकते हैं। Automation tools और trading alerts से इस प्रक्रिया को और smooth बनाया जा सकता है।
Swing Trading Indicators Explained
1. Ichimoku Cloud Indicator in Swing Trading
Ichimoku Cloud एक all-in-one indicator है जो trend, support-resistance और momentum एक साथ दिखाता है। Swing Traders इसका इस्तेमाल future price prediction के लिए करते हैं। Cloud (Kumo) मोटा हो तो market में high volatility होती है और पतला cloud support-resistance की तरह काम करता है। Tenkan-Sen और Kijun-Sen lines short-term और medium-term trends को reveal करती हैं।
2025 में Ichimoku Swing Trading के लिए बहुत useful है क्योंकि यह false signals filter करता है। जब price cloud के ऊपर होता है तो bullish trend और नीचे होता है तो bearish trend confirm होता है। Indian traders इसे Nifty, Bank Nifty और Stocks में daily या 4-hour chart पर use करते हैं। Beginners के लिए यह थोड़ा complex लग सकता है, लेकिन अगर सही तरीके से apply करें तो यह Swing Trading में powerful indicator साबित होता है।
2. Pivot Points for Swing Trading
Pivot Points सबसे लोकप्रिय support और resistance based tool है जिसे Swing Trading में use किया जाता है। यह calculation previous day’s high, low और close prices पर होती है। Traders Pivot Points को trend reversal और entry/exit points के लिए इस्तेमाल करते हैं। अगर price pivot point के ऊपर trade कर रहा है तो market bullish माना जाता है, और नीचे होने पर bearish bias रहता है। इसके साथ-साथ S1, S2, R1, R2 जैसे levels traders को stop loss और targets decide करने में help करते हैं।
Swing Trading में Pivot Points खासतौर पर intraday to multi-day trades के लिए perfect है क्योंकि यह market की psychology दिखाता है। 2025 में Pivot Points को EMA या MACD जैसे indicators के साथ combine करके और भी accurate trading decisions लिए जा सकते हैं।
3. ATR (Average True Range) for Volatility
ATR यानी Average True Range एक powerful indicator है जो market की volatility measure करता है। Swing Traders इसे खासतौर पर stop loss placement और position sizing के लिए use करते हैं। अगर ATR high है तो इसका मतलब market highly volatile है और wide stop loss की जरूरत है। वहीं low ATR stable price movement दिखाता है।
2025 में जब stock market में अचानक news-based moves आते हैं, ATR Swing Traders के लिए life-saver indicator बन जाता है। ATR खुद trend direction नहीं बताता, बल्कि यह signal देता है कि कितना risk लेना चाहिए। उदाहरण के लिए, अगर किसी stock का ATR ₹10 है और current price ₹200 है, तो traders stop loss ATR multiple के हिसाब से set कर सकते हैं। Risk management में ATR को EMA और RSI के साथ use करना सबसे effective तरीका है।
4. Supertrend Indicator for Swing Trading
Supertrend Indicator Swing Trading के लिए सबसे आसान और popular indicator है। यह mainly trend-following tool है जो buy और sell signals clearly देता है। Green Supertrend line दिखाती है कि market uptrend में है, जबकि red line downtrend दिखाती है। Swing Traders 4-hour या daily charts पर Supertrend का इस्तेमाल entry और exit points के लिए करते हैं। इसकी खासियत है simplicity – beginners भी इसे आसानी से समझ सकते हैं।
2025 में Supertrend को EMA और MACD के साथ combine करके best swing trading system बनाया जा सकता है। Indian traders इसका इस्तेमाल stocks, commodities और forex सभी markets में करते हैं। Stop loss हमेशा Supertrend line के नीचे (buy trade में) या ऊपर (sell trade में) set किया जाता है। Consistency से use किया जाए तो Supertrend indicator Swing Trading को काफी profitable बना सकता है।
5. VWAP (Volume Weighted Average Price)
VWAP यानी Volume Weighted Average Price institutional traders का favorite indicator है। यह दिखाता है कि किसी stock की average trading price क्या है, volume को ध्यान में रखते हुए। Swing Trading में VWAP का इस्तेमाल entry और exit points confirm करने के लिए किया जाता है। अगर price VWAP से ऊपर है तो यह bullish sign है और नीचे है तो bearish sign। VWAP को intraday charts पर ज्यादातर use किया जाता है, लेकिन Swing Traders इसे daily chart पर भी लगा सकते हैं।
2025 में जब FIIs और DIIs heavy volume में trading करते हैं, VWAP उनके footsteps को track करने का best तरीका है। VWAP को EMA या Bollinger Bands के साथ combine करने से trading accuracy और भी बढ़ जाती है। यह खासतौर पर उन stocks में काम करता है जहाँ volume heavy होता है।
6. ADX (Average Directional Index) for Swing Trading
ADX यानी Average Directional Index एक technical indicator है जो trend की strength measure करता है। Swing Traders इसे यह समझने के लिए use करते हैं कि market strong trend में है या सिर्फ sideways move कर रहा है। ADX की value अगर 25 से ऊपर है तो इसका मतलब है कि trend strong है, और 20 से नीचे होने पर market weak या range-bound है। ADX खुद direction (bullish या bearish) नहीं बताता, लेकिन यह signal देता है कि किस situation में trade लेना सही रहेगा।
Swing Trading में ADX को RSI और MACD के साथ combine करना बहुत powerful strategy है। 2025 में Indian market में ADX का importance और बढ़ गया है क्योंकि volatile conditions में यह false breakouts filter करने में help करता है। Professional traders इसे daily और 4-hour charts पर use करते हैं।
7. Heikin Ashi Candles for Clear Trends
Heikin Ashi candles एक special charting method है जो normal candlestick charts की तरह दिखती है लेकिन इसमें price smoothing होता है। Swing Trading में Heikin Ashi का सबसे बड़ा फायदा यह है कि यह noise filter करके clear trend दिखाता है। जब candles लगातार हरे दिखें तो bullish trend और लगातार लाल दिखें तो bearish trend confirm होता है।
Beginners के लिए यह बहुत useful है क्योंकि इसमें choppy markets में भी signals clear मिलते हैं। 2025 में traders इसे Supertrend और EMA के साथ combine करके Swing Trading में accuracy बढ़ा रहे हैं। Heikin Ashi long-term swings पकड़ने में effective है क्योंकि यह छोटे fluctuations को ignore करता है। Indian traders इसे खासतौर पर Bank Nifty और high beta stocks में use करते हैं जहाँ trends fast और powerful होते हैं।
Chart Patterns in Swing Trading
Swing Trading केवल indicators पर ही depend नहीं करती, बल्कि chart patterns भी बहुत important होते हैं। Popular patterns जैसे Head & Shoulders, Double Top/Bottom, Cup & Handle, Flags और Pennants Swing Traders को strong entry और exit points देते हैं। उदाहरण के लिए, Double Bottom pattern market reversal का संकेत देता है जबकि Flag pattern continuation trend को confirm करता है।
2025 में chart patterns को indicators जैसे RSI और MACD के साथ confirm करके use करना सबसे effective strategy है। Swing Trading में patterns का फायदा यह है कि ये market psychology को reveal करते हैं। Indian market में chart patterns Nifty, Bank Nifty और large-cap stocks पर सबसे ज्यादा reliable माने जाते हैं। Beginners को पहले chart patterns को identify करना सीखना चाहिए क्योंकि यह low-risk, high-reward setups provide करते हैं।
Swing Trading in Options & Futures
Swing Trading केवल equity stocks तक सीमित नहीं है। Options और Futures में भी swing trading काफी popular है। Options traders short-term swings पकड़ने के लिए call और put options का use करते हैं, जबकि futures traders leverage के साथ big moves का फायदा उठाते हैं।
2025 में options liquidity Indian market में बहुत बढ़ गई है, जिससे swing traders को ज्यादा opportunities मिल रही हैं। Indicators जैसे ATR और Supertrend options में stop loss और entry points decide करने के लिए बहुत helpful होते हैं। Futures trading risky हो सकता है क्योंकि इसमें leverage होता है, लेकिन अगर सही risk management किया जाए तो यह high profits दे सकता है। Beginners को पहले equities में practice करनी चाहिए और फिर gradually derivatives market में swing trading शुरू करनी चाहिए।
Swing Trading in Crypto Market
Crypto market में swing trading बहुत exciting है क्योंकि इसमें high volatility होती है। Bitcoin, Ethereum और altcoins short-term swings के लिए perfect assets हैं। Swing Traders crypto में EMA, RSI और MACD का use करके entries और exits plan करते हैं। 2025 में crypto market ज्यादा mature हो गया है और कई Indian traders भी इसमें actively swing trading कर रहे हैं। Crypto exchanges जैसे Binance और Coinbase पर charts और indicators easily available हैं।
Crypto market 24/7 चलता है, इसलिए swing traders को time management और stop loss strategies पर extra ध्यान देना पड़ता है। Bollinger Bands और ATR crypto swing trading में खासतौर पर useful हैं क्योंकि ये price volatility को measure करते हैं। अगर proper strategy use की जाए तो crypto swing trading high profits दे सकती है, लेकिन risk भी उतना ही ज्यादा होता है।
Best Timeframes for Swing Trading
Swing Trading का सबसे बड़ा सवाल होता है – कौन सा timeframe best है?
Usually, Swing Traders daily, 4-hour और weekly charts का use करते हैं। Daily chart long swings पकड़ने के लिए perfect है, जबकि 4-hour chart short swings identify करने के लिए helpful होता है। Weekly chart broader trend confirm करने में मदद करता है। Beginners को daily chart से start करना चाहिए क्योंकि इसमें signals clear मिलते हैं और noise कम होता है।
2025 में traders multi-timeframe analysis use कर रहे हैं, यानी पहले weekly trend check करते हैं, फिर daily पर entry plan करते हैं और 4-hour पर refine करते हैं। EMA, RSI और MACD जैसे indicators इन timeframes पर सबसे ज्यादा reliable होते हैं। Wrong timeframe चुनना swing trading में सबसे बड़ी गलती है। इसलिए सही timeframe चुनना profitable swing trading के लिए foundation step है।
Backtesting Swing Trading Strategies
Swing Trading में सिर्फ strategy बनाना काफी नहीं है, उसे backtest करना भी जरूरी है। Backtesting का मतलब है किसी strategy को historical data पर test करना ताकि पता चले कि वह past में profitable रही है या नहीं। TradingView, Amibroker और Python backtesting tools इस काम में काफी popular हैं।
Backtesting से पता चलता है कि strategy में win rate, average profit/loss, drawdown और risk-reward ratio कैसा है। 2025 में AI और machine learning based backtesting tools भी available हैं जो complex data analyze करके traders को edge देते हैं। Swing Traders को हमेशा अपनी strategy को कम से कम 2–3 साल के data पर backtest करना चाहिए। इससे confidence बढ़ता है और गलत trades avoid होते हैं। Backtesting से आप समझ सकते हैं कि कौन से indicators (जैसे EMA, MACD, Supertrend) आपके लिए best काम करते हैं।
Paper Trading for Beginners
Beginners के लिए सबसे अच्छा तरीका है पहले Paper Trading करना। Paper Trading का मतलब है real market conditions में बिना पैसे invest किए virtual trades करना। इससे beginners strategy test कर सकते हैं, बिना पैसे खोए हुए। Zerodha Varsity, TradingView और कई broker platforms free paper trading options देते हैं। Paper Trading से beginners को समझ आता है कि कौन सा indicator (EMA, RSI, Supertrend) उनके लिए ज्यादा profitable है और कहाँ उन्हें गलत signals मिल रहे हैं।
2025 में कई apps AI-based paper trading भी offer कर रहे हैं जो beginners को advanced simulation देते हैं। Swing Trading में confidence build करना बहुत जरूरी है, और paper trading उसका सबसे सुरक्षित तरीका है। एक beginner को कम से कम 1–2 महीने paper trading करनी चाहिए, फिर धीरे-धीरे real money के साथ छोटे trades शुरू करने चाहिए।
Swing Trading with ETFs
Swing Trading सिर्फ stocks तक सीमित नहीं है, बल्कि ETFs (Exchange Traded Funds) में भी की जा सकती है। ETFs diversified assets होते हैं जो एक ही sector या index को represent करते हैं। Example: Nifty 50 ETF, Bank Nifty ETF या Gold ETF। Swing Traders ETFs को इसलिए पसंद करते हैं क्योंकि इसमें diversification और liquidity दोनों होते हैं।
Indicators जैसे Moving Averages, MACD और Bollinger Bands ETFs पर भी उतने ही effective हैं। 2025 में Indian market में thematic ETFs (जैसे IT, Pharma, Energy ETFs) काफी popular हो गए हैं। Swing Traders sector rotation strategy का use करके ETFs में profits कमा रहे हैं। ETFs beginners के लिए भी अच्छे हैं क्योंकि इसमें individual stock risk कम होता है और broader sector या index का फायदा मिलता है। Swing Trading with ETFs safe और profitable दोनों हो सकता है।
Kelly Criterion in Position Sizing
Swing Trading में सिर्फ entry-exit strategy ही जरूरी नहीं है, बल्कि position sizing equally important है। Kelly Criterion एक advanced formula है जो बताता है कि किसी trade में कितना capital risk करना चाहिए। इसका calculation win rate और risk-reward ratio पर आधारित होता है।
Example: अगर आपकी strategy का win rate 60% है और risk-reward ratio 1:2 है, तो Kelly Criterion बताता है कि कितने percent capital invest करना safe है। 2025 में कई professional swing traders Kelly Criterion को risk management के लिए use कर रहे हैं। इसका फायदा यह है कि over-trading और under-trading दोनों से बचा जा सकता है। Beginners के लिए simple rule है – कभी भी एक trade में total capital का 2–5% से ज्यादा invest न करें। Kelly Criterion Swing Traders को long-term में profitable और sustainable बनाता है।
Hedging Techniques for Swing Trading
Swing Trading में hedging एक smart तरीका है risk को manage करने का। Hedging का मतलब होता है अपने portfolio या trade को protect करना by taking an opposite position। Example: अगर आपने किसी stock में long position ली है, तो risk reduce करने के लिए आप उसी sector का ETF short कर सकते हैं।
Indian market में traders अक्सर options hedging करते हैं – जैसे stock खरीदने के साथ put option लेना। 2025 में volatile market conditions में hedging techniques और भी important हो गए हैं क्योंकि यह अचानक losses से बचाती हैं। Indicators जैसे ATR और ADX hedging की जरूरत signal करने में helpful होते हैं। Hedging beginners के लिए थोड़ा complex हो सकता है, लेकिन अगर सही strategy बनाई जाए तो यह Swing Trading को ज्यादा safe और profitable बना देता है।
Diversification for Swing Traders
“Never put all your eggs in one basket” – यह rule Swing Trading पर भी apply होता है। Diversification का मतलब है capital को अलग-अलग stocks, sectors और asset classes में distribute करना। Example: अगर आप केवल IT stocks में invest करते हैं और sector गिर जाता है, तो पूरा portfolio risk में आ जाता है। लेकिन अगर आपने IT, Pharma, Banking और Energy में diversified swing trades लिए हैं, तो risk कम हो जाता है।
2025 में Indian market में sector rotation काफी active है, इसलिए diversification swing traders के लिए जरूरी हो गया है। Diversification ETFs और Index funds के जरिए भी किया जा सकता है। Beginners को हमेशा कम से कम 3–4 sectors में swing trades लेने चाहिए। इससे एक sector में नुकसान होने पर दूसरा sector balance कर देता है। Diversification = Risk कम, Profit stable।
AI & Machine Learning in Swing Trading
2025 का stock market Artificial Intelligence (AI) और Machine Learning (ML) से काफी influenced है। Swing Traders अब सिर्फ manual indicators जैसे EMA और RSI पर depend नहीं रहते, बल्कि AI tools का use करके data-driven decisions लेते हैं। AI-based algorithms real-time data analyze करते हैं और trade signals generate करते हैं।
Machine Learning models पिछले price patterns और market behavior को study करके future predictions देते हैं। कई brokers और fintech apps अब AI swing trading tools offer कर रहे हैं। Example: sentiment analysis tools जो news और social media से signals निकालते हैं। Indian traders भी algorithmic trading को adopt कर रहे हैं। हालांकि AI हर trader को replace नहीं कर सकता, लेकिन यह swing traders को edge और speed जरूर देता है। Future में AI और Swing Trading का combination market में बड़ा game-changer होगा।
Best Swing Trading Apps & Platforms (India/Global)
Swing Trading के लिए सही platform चुनना बहुत जरूरी है। Indian market में Zerodha Kite, Upstox Pro, Angel One और ICICI Direct जैसे apps swing traders के बीच सबसे popular हैं। ये apps advanced charts, indicators (EMA, RSI, MACD, Supertrend) और price alerts provide करते हैं।
Global traders TradingView, Thinkorswim और Interactive Brokers जैसे platforms को prefer करते हैं। 2025 में mobile trading apps ने Swing Trading को और accessible बना दिया है। अब traders कहीं भी charts analyze कर सकते हैं और trades execute कर सकते हैं। Beginners के लिए TradingView सबसे best है क्योंकि इसमें free charting tools और community ideas available हैं। सही app चुनते समय low brokerage, fast execution, charting tools और backtesting features पर ध्यान देना चाहिए। सही platform swing traders को competitive edge देता है।
Future of Swing Trading (2025–2030)
2025 से 2030 के बीच Swing Trading का future बहुत promising दिख रहा है। Indian stock market तेजी से grow कर रहा है और retail participation बढ़ रही है। FIIs और DIIs भी short-to-medium term swings का फायदा उठा रहे हैं। Future में AI-based trading, algo trading और robo-advisors Swing Trading को और भी advanced बना देंगे।
Crypto और global commodities भी Swing Traders के लिए बड़े opportunities देंगे। लेकिन साथ ही, market में high volatility और fast news flow risks भी create करेंगे। इसलिए future swing traders को सिर्फ EMA, RSI और MACD तक सीमित नहीं रहना चाहिए, बल्कि advanced tools, risk management और diversification को अपनाना होगा। जो traders technology adopt करेंगे और discipline maintain करेंगे, वे 2025–2030 के बीच सबसे ज्यादा profitable होंगे।
Swing Trading Strategies
Swing Trading Strategies price trends और reversals पर आधारित होती हैं। Trend Following Strategy में EMA और MACD का उपयोग करके strong trends में entry होती है। Stop Loss और Take Profit हमेशा set करना जरूरी है। Reversal Strategy में RSI और candlestick patterns overbought/oversold conditions पर entry points दिखाते हैं।
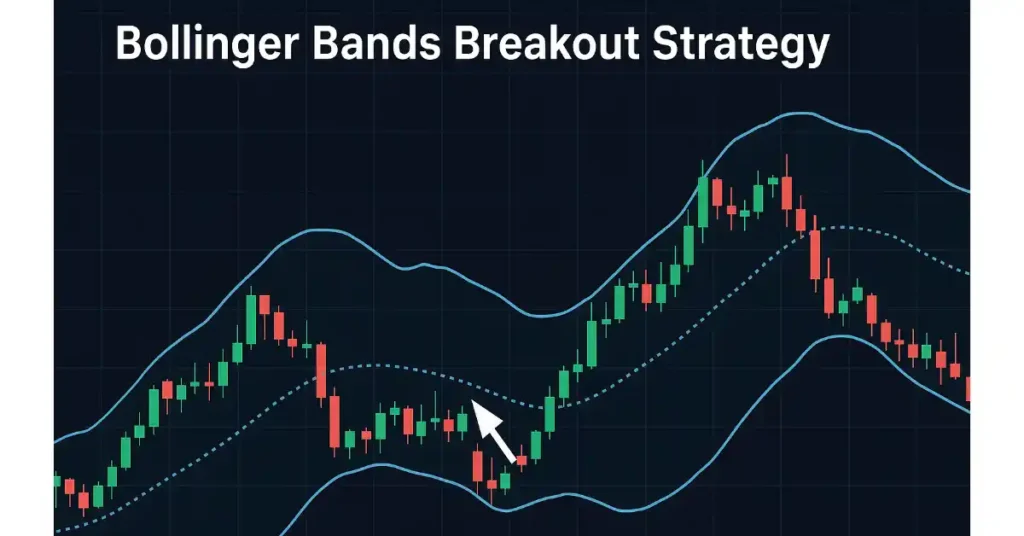
Breakout Strategy में Bollinger Bands और volume indicators combine करके new breakout identify किया जाता है। Automation और trading alerts से traders timely signals पा सकते हैं। Multi-timeframe analysis confirm करता है कि trend short-term और long-term दोनों में consistent है।
Swing Trading Strategies disciplined approach, Risk-to-Reward ratio, position sizing और proper exit strategy के साथ implement करनी चाहिए। यह beginners और experienced traders दोनों के लिए effective होती हैं।
Market Cycle and Sector Performance
Market Cycle चार phases में divided होता है: Expansion, Peak, Contraction और Recovery। हर phase में outperforming sectors अलग होते हैं। Expansion में IT और consumer discretionary sectors perform करते हैं। Peak phase में defensive sectors जैसे FMCG और Pharma outperform करते हैं। Contraction में utility और healthcare sectors outperform करते हैं। Recovery phase में cyclical sectors फिर से rise करते हैं।
Sector Rotation Strategy traders को weak sectors से strong sectors में capital shift करने में मदद करती है। EMA, RSI और MACD indicators sector trends identify करने में मदद करते हैं। Fundamental data जैसे GDP growth, CPI और interest rates combined analysis provide करते हैं। Market cycle को समझकर traders Short-Term Profit Opportunities maximize कर सकते हैं।
Sector Rotation and Indicators
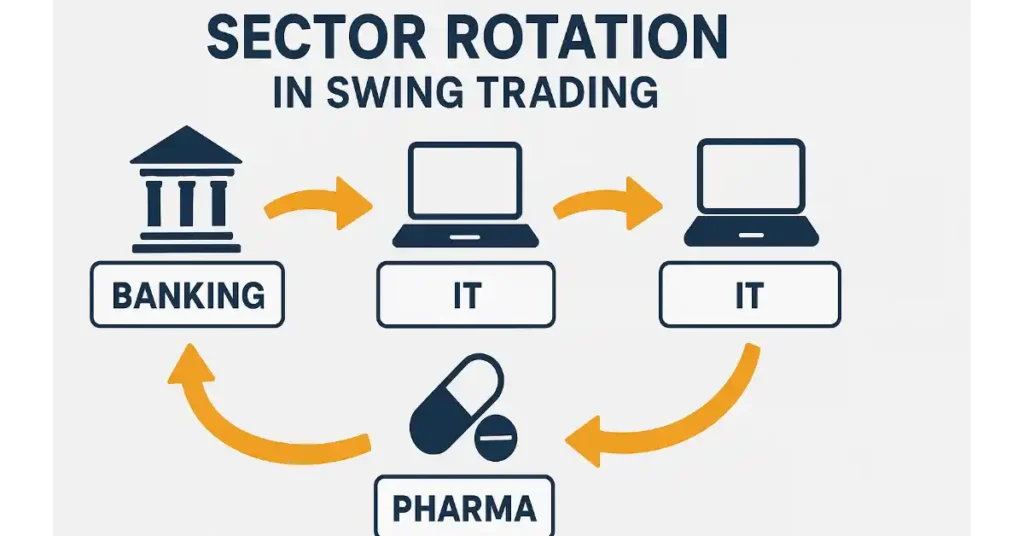
Sector Rotation Strategy का उद्देश्य underperforming sectors से outperforming sectors में capital shift करना है। Traders EMA, RSI और MACD indicators का उपयोग करके sectors का trend analyze करते हैं। Early entry outperforming sectors में और timely exit underperforming sectors से high returns provide करता है।
Volume indicators और price breakout signals से confirmation मिलता है। Fundamental data जैसे earnings reports, corporate announcements और economic indicators sector rotation decision में support करते हैं। Automation tools और trading alerts timely action लेने में मदद करते हैं।
इस strategy का सही इस्तेमाल Short-Term Profit Opportunities और risk-adjusted returns को maximize करता है। Swing traders इसे portfolio diversification के साथ combine करके consistent profits generate कर सकते हैं।
Fundamental and Economic Analysis
Swing Trading में Fundamental और Economic Analysis short-term price movements को समझने में मदद करता है। GDP growth, CPI, interest rates और corporate earnings जैसे economic indicators स्टॉक मार्केट पर असर डालते हैं।
Traders Swing Trading Indicators के साथ इन डेटा points को analyze करके high-probability trades identify कर सकते हैं। उदाहरण के लिए, किसी IT कंपनी की strong quarterly earnings और favorable economic trends मिलकर stock को short-term upward trend में push कर सकते हैं।
Macro data और sector-specific news combined analysis से entry और exit points और भी accurate बनते हैं। Traders automation tools और trading alerts का उपयोग करके fast-moving markets में timely action ले सकते हैं।
Fundamental और technical analysis का combination risk-adjusted returns और Short-Term Profit Opportunities maximize करता है।
Trading Psychology and Discipline
Trading Psychology Swing Trading में सफलता का महत्वपूर्ण हिस्सा है। Greed और Fear emotions को control करना जरूरी है। Emotional trading losses को बढ़ा सकता है।
Discipline maintain करने के लिए traders journals maintain करते हैं। इसमें entry, exit, risk-reward ratio और trade rationale record होता है। Regular journaling mistakes identify करने और strategy improve करने में मदद करता है।
Short-Term Trading Guide में strict discipline और risk management जरूरी है। Automation tools और alerts traders को impulsive decisions से बचाते हैं। Multi-timeframe analysis और trend confirmation combined approach में confidence बढ़ाते हैं।
Trading Psychology और discipline अपनाकर traders consistent profits generate कर सकते हैं। यह beginners और advanced traders दोनों के लिए equally महत्वपूर्ण है।
Risk-to-Reward Ratio and Position Sizing
Risk-to-Reward Ratio (R:R) और Position Sizing Swing Trading का backbone हैं। Recommended ratio 1:2 या 1:3 होता है। इसका मतलब, अगर risk ₹100 है, तो potential reward कम से कम ₹200 होना चाहिए।
Position Sizing capital protection और loss limit करने में मदद करता है। Traders portfolio में किसी भी trade के लिए सही capital allocate करके overexposure से बचते हैं। Automation tools और trading alerts risk monitoring में मदद करते हैं।
High probability trades identify करने के बाद R:R और position size calculate करना जरूरी है। यह approach disciplined trading, consistent profits और Short-Term Profit Opportunities maximize करने में मदद करता है।
Stop Loss and Take Profit Settings
Stop Loss और Take Profit Short-Term Trading में loss limit और profits secure करने के लिए जरूरी हैं। Stop Loss predetermined price level है, जिस पर trade automatically close हो जाता है ताकि नुकसान minimum रहे। Take Profit वह level है जिस पर target profits book किए जाते हैं।
Example: Stock ₹1000 में खरीदा → Stop Loss ₹970, Take Profit ₹1050। Automation tools और trading alerts timely execution में मदद करते हैं। Indicators जैसे EMA, RSI और MACD Strategy stop loss और take profit set करने में मदद करते हैं।
Proper Stop Loss और Take Profit settings risk-adjusted returns maximize करती हैं। Candlestick Patterns और multi-timeframe analysis confirm करते हैं कि price levels accurate हैं।
Candlestick Patterns in Hindi
Candlestick Patterns price action और short-term reversals identify करने में मदद करते हैं। प्रमुख patterns: Hammer, Doji, Engulfing।
Hammer low price पर reversal indicate करता है। Doji indecision दिखाता है। Engulfing pattern trend change signal देता है। Swing Trading Indicators जैसे EMA और RSI के साथ candlestick patterns confirm signals देते हैं।
Multi-timeframe analysis और trend confirmation combined approach में accuracy बढ़ाता है। Automation tools और alerts timely action लेने में मदद करते हैं। Candlestick Patterns Short-Term Trading Guide का essential part हैं।
Multi-Timeframe Analysis
Multi-Timeframe Analysis short-term और long-term trend confirm करने में मदद करता है। Traders 1-hour, 4-hour और daily charts analyze करके entry और exit points accurate बनाते हैं।
EMA, RSI और MACD indicators multi-timeframe में consistent trend दिखाएंगे। Price patterns और candlestick signals भी different timeframes में confirm होते हैं।
Automation tools और trading alerts timely signals detect करने में मदद करते हैं। Multi-Timeframe Analysis combined with Sector Rotation Strategy और Fundamental Data Short-Term Profit Opportunities maximize करता है।
Correlation Analysis
Correlation Analysis से traders stocks, sectors और indices के बीच relationship समझते हैं। Positive correlation → stocks एक साथ move करते हैं। Negative correlation → stocks opposite direction में move करते हैं।
Sector rotation और portfolio diversification decisions correlation analysis पर आधारित होते हैं। EMA, RSI और MACD combined approach से correlated assets में trading strategy develop की जाती है।
Automation tools और alerts correlated movement detect करने में मदद करते हैं। Short-Term Trading Guide में correlation analysis risk-adjusted returns maximize करता है।
Earnings and Corporate Announcements Impact
Quarterly earnings, dividends और corporate announcements stock prices पर immediate effect डालते हैं। Positive earnings surprise → stock short-term upward trend में। Negative announcement → downward trend।
Swing Trading Indicators combined with Fundamental Data entry और exit points identify करने में मदद करते हैं। EMA, RSI और MACD Strategy corporate events के प्रभाव को predict कर सकते हैं।
Automation tools और trading alerts timely action लेने में मदद करते हैं। Earnings और corporate announcements analysis Short-Term Profit Opportunities maximize करता है।
Swing Trading vs Scalping vs Long-Term Investing
Swing Trading short-term profit opportunities capture करता है। Scalping ultra-short-term trades (minutes) focus करता है। Long-Term Investing years तक holding और fundamental growth focus करता है।
Timeframe, risk appetite और trading style decide करते हैं कि कौन सा approach best है। Swing Trading Indicators, EMA, RSI, MACD और Bollinger Bands short-term trend capture करने में मदद करते हैं।
Automation tools और trading alerts short-term trades में timely execution सुनिश्चित करते हैं। Candlestick Patterns और Multi-Timeframe Analysis short-term trend confirmation में मदद करते हैं।
Taxation and Compliance
भारत में Short-Term Capital Gains (STCG) पर 15% tax applicable होता है। Traders को trading reports और compliance maintain करना जरूरी है।
Swing Trading Indicators और Automation tools trading activity monitor करने में मदद करते हैं। Proper record keeping और tax planning से legal issues avoid होते हैं।
Fundamental data और trading strategy के साथ tax-efficient planning profits maximize कर सकती है। Beginners को tax rules और compliance पर ध्यान देना चाहिए।
Automation and Alerts
Automation tools और trading alerts timely signals detect करने में मदद करते हैं। Price alerts, EMA/RSI alerts और auto-trading bots Short-Term Profit Opportunities maximize करते हैं।
Swing Trading Indicators combined approach short-term trends identify करते हैं। Automation impulsive trading और missed opportunities से बचाता है। Multi-Timeframe Analysis और candlestick confirmation alerts को support करता है।
Common Mistakes and How to Avoid Them
Common mistakes: Overtrading, Indicator overuse, Emotional trading। Discipline, journaling और risk management adopt करके इनसे बचा जा सकता है।
EMA, RSI और MACD combined approach accurate entry और exit points provide करते हैं। Automation tools और alerts impulsive decisions prevent करते हैं।
Short-Term Trading Guide के साथ strategy implement करना consistent profits के लिए जरूरी है।
Real-Life Example
Stock: Infosys
Entry: ₹1,500 (EMA Crossover + RSI Oversold)
Exit: ₹1,570 (7 Days Later) → Profit 4.66%
Candlestick Patterns, EMA, RSI और MACD Strategy combine करके trade plan बनाना। Stop Loss ₹1,470 और Take Profit ₹1,570 set किया। Automation alerts timely execution में मदद करते हैं।
FAQs
Q 1. Swing Trading क्या है?
Swing Trading short-to-medium term trading strategy है जिसमें traders 2–10 दिनों तक positions hold करते हैं। EMA, RSI, MACD जैसे indicators से entries और exits decide किए जाते हैं।
Q 2. Swing Trading beginners के लिए अच्छा है?
हाँ, Swing Trading beginners के लिए अच्छा है क्योंकि इसमें intraday trading से कम stress और time लगता है। Proper risk management और EMA, RSI जैसे indicators जरूरी हैं।
Q 3. Swing Trading और Intraday Trading में फर्क क्या है?
Intraday trading में same-day trades close करनी होती हैं, जबकि Swing Trading positions कुछ दिन से हफ्तों तक hold की जाती हैं। Swing Trading में indicators ज्यादा reliable होते हैं।
Q 4. Swing Trading के लिए सबसे अच्छा indicator कौन सा है?
EMA, RSI और MACD Swing Trading के लिए सबसे popular indicators हैं। Beginners को पहले simple indicators से शुरुआत करनी चाहिए और बाद में Supertrend और ATR add करना चाहिए।
Q 5. Swing Trading के लिए best timeframes कौन से हैं?
Swing Traders आमतौर पर daily और 4-hour charts use करते हैं। Daily chart trend identify करने में helpful है जबकि 4-hour chart entries refine करने में useful है।
Q 6. क्या Swing Trading में ज्यादा risk होता है?
हाँ, Swing Trading में risk होता है, लेकिन intraday से कम। सही stop loss, diversification और risk management strategy से loss control किया जा सकता है।
Q 7. Swing Trading के लिए कितना capital चाहिए?
Beginners 10,000–25,000 INR से Swing Trading शुरू कर सकते हैं। Capital का 2–5% ही एक trade में risk करें। Discipline capital preservation के लिए जरूरी है।
Q 8. क्या Swing Trading long-term investing से बेहतर है?
Swing Trading short-term profits देती है जबकि investing wealth creation के लिए होती है। दोनों approaches अलग हैं, traders को अपनी risk appetite और goals के अनुसार चुनना चाहिए।
Q 9. Swing Trading के लिए सबसे अच्छे stocks कैसे चुनें?
High liquidity और volatility वाले stocks चुनें। Nifty50 और sector leaders अच्छे होते हैं। EMA, RSI और VWAP जैसे indicators से सही entry points मिलते हैं।
Q 10. Swing Trading में losses कैसे avoid करें?
Losses avoid करने के लिए stop loss use करें, proper risk-reward ratio maintain करें और trade बिना confirmation indicators के avoid करें। Diversification भी बहुत helpful है।
Q 11. क्या Swing Trading crypto market में possible है?
हाँ, Swing Trading crypto में possible है। Bitcoin, Ethereum और altcoins में EMA, MACD और Bollinger Bands use करके profitable trades possible हैं। लेकिन volatility ज्यादा होती है।
Q 12. Swing Trading beginners को कौन सा app use करना चाहिए?
Beginners Zerodha Kite, Upstox Pro और TradingView apps use कर सकते हैं। ये advanced charts, price alerts और indicators जैसे Supertrend और RSI provide करते हैं।
Q 13. Swing Trading के लिए AI tools useful हैं?
हाँ, 2025 में AI और Machine Learning tools swing traders को edge देते हैं। ये real-time data analyze करके better entries और exits identify करते हैं।
Q 14. Swing Trading में सबसे बड़ी mistake क्या होती है?
Beginners अक्सर बिना stop loss trade करते हैं और overtrading कर देते हैं। गलत timeframe चुनना और सिर्फ एक indicator पर depend करना भी बड़ी mistake है।
Q 15. Swing Trading के लिए ETFs अच्छे हैं?
हाँ, ETFs beginners और professionals दोनों के लिए अच्छे हैं क्योंकि ये diversification provide करते हैं। Nifty, Bank Nifty और sector ETFs swing trading के लिए popular हैं।
Q 16. क्या Swing Trading full-time job बन सकती है?
हाँ, अगर strategy consistent है तो Swing Trading full-time income बना सकती है। लेकिन beginners को पहले part-time शुरू करना चाहिए और experience के बाद full-time जाना चाहिए।
Q 17. Swing Trading में hedging कैसे useful है?
Hedging risk कम करता है। Example: Stock buy करने के साथ put option लेना। यह sudden market गिरावट में portfolio protect करता है। Advanced traders अक्सर hedging करते हैं।
Q 18. Swing Trading में कौन-कौन से chart patterns useful हैं?
Head & Shoulders, Double Top/Bottom, Cup & Handle और Flags Swing Trading के लिए सबसे useful patterns हैं। Indicators के साथ confirm करने पर ये high-probability setups provide करते हैं।
Q 19. क्या Swing Trading intraday से ज्यादा profitable है?
हाँ, Swing Trading intraday से ज्यादा profitable हो सकती है क्योंकि इसमें bigger price moves capture होते हैं। लेकिन patience और discipline जरूरी हैं। Intraday fast profits देता है।
Q 20. 2025–2030 में Swing Trading का future कैसा है?
Swing Trading का future बहुत promising है। AI tools, algo trading और ETFs swing traders को new opportunities देंगे। लेकिन risk management और discipline हमेशा key रहेंगे।
Conclusion
Swing Trading Indicators, EMA and RSI Trading, MACD Strategy, Bollinger Bands Breakout, Sector Rotation Strategy, Risk Management, Candlestick Patterns और AI Tools combine करके 2025 में Short-Term Profit Opportunities maximize की जा सकती हैं। Discipline, Automation और proper Strategy consistent profits सुनिश्चित करते हैं।
Disclaimer
यह ब्लॉग केवल शैक्षिक और जानकारी देने के उद्देश्य से लिखा गया है। इसमें बताए गए सभी Swing Trading Indicators, Strategies और Tools सामान्य जानकारी के लिए हैं, यह किसी भी प्रकार की financial, investment या trading advice नहीं है। Stock Market और Swing Trading में हमेशा risk जुड़ा होता है और past performance future results की guarantee नहीं देती। किसी भी प्रकार का निवेश या ट्रेड करने से पहले, कृपया अपनी स्थिति के अनुसार registered financial advisor या expert से सलाह लें। इस ब्लॉग के आधार पर लिए गए निर्णयों की पूरी जिम्मेदारी पाठक की स्वयं की होगी।